
Summary of Audio spectrum analyzer using PIC18F4550
This project builds a real-time audio spectrum analyser using a PIC18F4550 microcontroller. It performs 16-bit FFT in C on amplified and DC-shifted audio, displays results on a 128x64 graphical LCD, and uses simple analog front-end filtering and mixing to prepare line-level stereo for ADC sampling and anti-aliasing.
Parts used in the Audio Spectrum Analyser:
- PIC18F4550 microcontroller
- LM386-1 audio amplifier IC
- 128x64 graphical dot-matrix LCD
- 10K resistors (two for stereo mixing)
- 10K potentiometer
- Passive RC filter components (resistor and capacitor for ~10kHz roll-off)
- Three LEDs
- Two user switches
- Phono sockets (input and pass-through)
- Power supply (0V and 5V)
Introduction
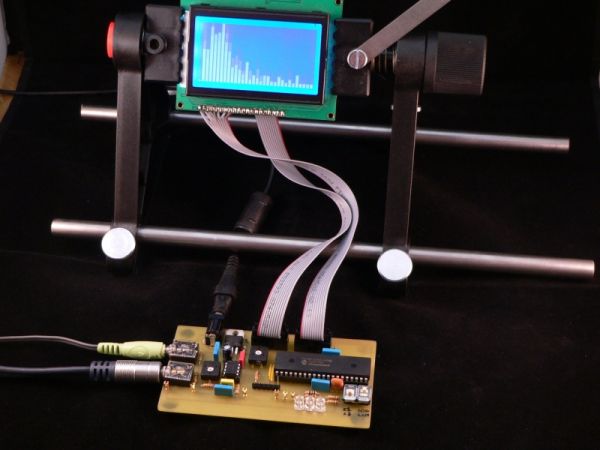
This project implements a real-time audio spectrum analyser using a PIC18F4550 8-bit microcontroller. The spectrum frequency analysis is performed by a highly optimised 16-bit Fast Fourier Transformation (FFT) routine coded entirely in C. The output from the FFT is displayed using a 128×64 graphical LCD to allow a real-time view of an audio signal.
Hardware
In order to perform a FFT calculation on an audio signal it is necessary to prepare the audio so the PIC18F4550 can sample the signal. The PIC18F4550 provides several analogue to digital converters (ADCs) which can be used to measure a voltage from 0V to 5V with 10-bit accuracy (0-1023). A typical audio line-out signal is an analogue wave with a peak-to-peak intensity of 2V centred around 0V (i.e. it is an AC signal ranging from +1 to -1V) as shown by the following oscilloscope trace (from pin W2 of the demo board):
The picture shows a full-volume 5000Hz sine wave generated by a PC. If we were to feed this signal directly to the PIC we would only have a very small range of input voltage (0-0.5V) and also we would only be able to sample the top-half of the signal which would make the FFT incorrect.
In order to correctly sample the signal we have to do two things. Firstly we need to amplify the signal to ensure we can use as much of the 0-5V range as possible. Secondly we have to move the signal’s ground (of 0 volts) to a ‘virtual ground’ of 2.5Vs. This will allow the PIC to sample both the positive and the negative sides of the input signal. To do this the demonstration board uses a simple amplifier IC (the LM386-1). Since the IC is powered from a 0V and 5V power supply it has the handy side-effect of also moving the signal into the middle of our required power range. The LM386-1 was used because it is cheap and simple, however you could use a rail-to-rail opamp to achieve the same thing with a few more external components.
The following oscilloscope trace shows the output signal from the LM386-1 (for the signal shown above), the scope voltage range is set to 5 volts (from pin W3 of the demo board):
The hardware mixes the stereo line-in using two 10K resistors which act as a simple mixer. The signal is then passed to the LM386-1 via a 10K potentiometer which allows the signal strength to be adjusted. Next the LM386-1 amplifier output is passed through a simple RC Filter which rolls off the signal at about 10Khz. The resulting signal is then fed into an ADC pin on the PIC18F4550. The 10Khz filter acts as an ‘anti-aliasing’ filter for the FFT which cannot correctly detect signals with a frequency of greater than 10KHz. An RC filter is a very simple type of filter (and very ineffective) but it was chosen since it is easy to build and only requires 2 passive components. Typically a professional spectrum analyser would implement the anti-alias filter at 80% of the Nyquist frequency for the FFT (see below), but since we are so speed-limited with the PIC this is not possible to do in the design.
The demo board also controls a standard 128×64 dot-matrix LCD as well as 3 LEDs (for testing sound-to-light conversion). In addition there are 2 switches to allow the user to control the LCD’s output depending on what is being measured and how it is to be displayed. The second phono socket allows you to pass-through the input signal to another audio device such as headphones or speakers.
For more detail: Audio spectrum analyzer using PIC18F4550
- What microcontroller is used in the project?
The project uses a PIC18F4550 microcontroller. - How is the audio signal prepared for the ADC?
The audio is mixed, amplified with an LM386-1, DC-shifted to a virtual 2.5V ground, and passed through an RC anti-aliasing filter before the ADC. - Does the project perform FFT in hardware or software?
The project performs a 16-bit Fast Fourier Transform entirely in C on the PIC18F4550. - What display is used to show the FFT output?
A 128x64 graphical dot-matrix LCD displays the FFT output. - What purpose do the two 10K resistors serve?
The two 10K resistors act as a simple stereo mixer for the line-in signals. - Why is an RC filter used and what is its cutoff?
An RC filter is used as a simple anti-aliasing filter and it rolls off around 10kHz. - Can the LM386-1 also shift the signal to the required DC level?
Yes, powering the LM386-1 from 0V and 5V shifts the signal into the middle of the range, creating the required virtual ground. - Are there controls for adjusting signal strength?
Yes, a 10K potentiometer is used to adjust the signal strength before the amplifier.

