Summary of ECT358L – Microprocessors II Laboratory Setting up and Using the Microchip MPLAB IDE
This article details the installation and setup of MPLAB IDE 8.33 for PIC18F4520 microcontroller projects. It covers downloading, installing components (excluding HI-TECH C), creating a project structure, selecting the MPASM tool suite, building the code, and utilizing the built-in simulator for debugging, tracing, and monitoring memory registers.
Parts used in the MPLAB Installation Project:
- MPLAB_IDE_8_33.zip
- Install_MPLAB_8_33.exe
- PIC18F4520 device
- MPASM tool suite
- LAB1.asm source file
- P18F4520.inc header file
- MPLAB SIM debugger
MPLAB Installation
- Download the MPLAB 8.33 application (MPLAB_IDE_8_33.zip) from the course
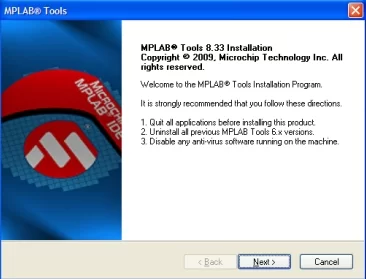
website under Lab 1 - Extract the MPLAB_IDE_8_33 folder and select the “Install_MPLAB_8_33.exe” file to
start the installation process as shown in Figure 1.
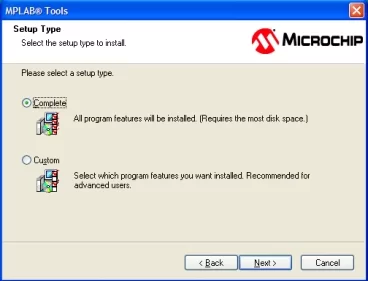
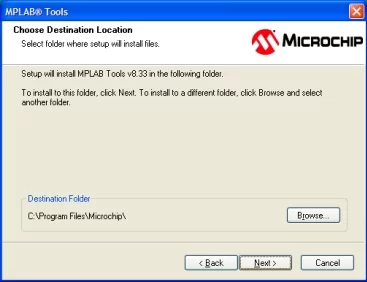
- Do a complete install of all the MPLAB components as shown in Figure 2 using the
default destination directory as shown in Figure 3. Make sure to accept all licensing of the
MPLAB application.
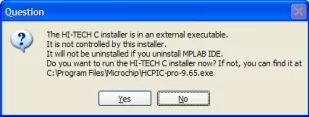
- Do not install the HI-TECH C compiler by selecting the No option as shown in Figure4.
The Microchip C18 compiler will be used in this class, however note that the executable
to install the HI-TECH compiler will be installed for future installation if desired.
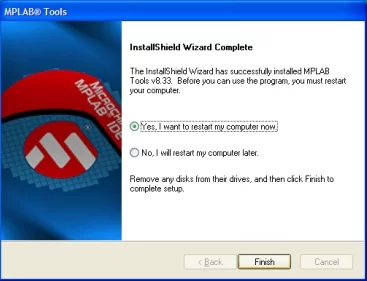
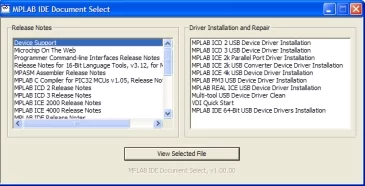
- Once the installation completes restart the computer as shown in Figure 5. Upon restart,
the window shown in Figure 6 will open, allowing the user to read from a variety of
documents.
MPLAB Usage, Project Setup, & Building
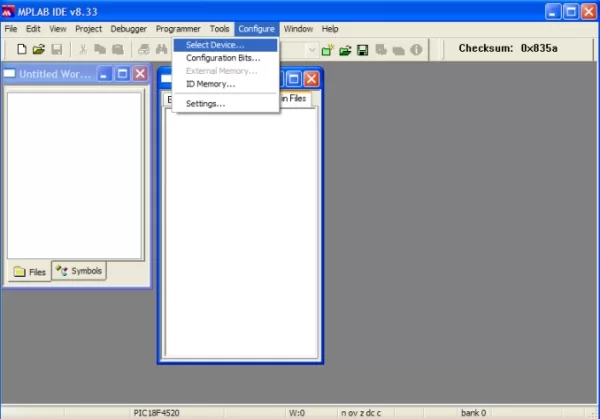
- Open the MPLAB IDE using the desktop icon or by selecting the “MPLAB IDE”
option from All Programs >> Microchip >> MPLAD IDE v8.33. The IDE environment
should open as shown in Figure 7 and the “Select Device” option should be selected from
the “Configure” menu.
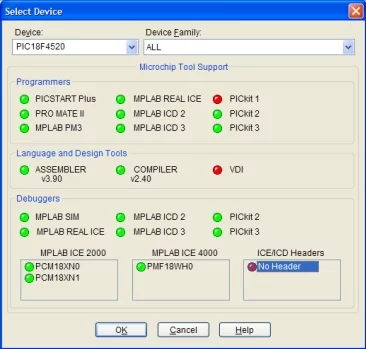
- The “Select Device” window should be identical to the one shown in Figure 8. Make
sure the PIC18F4520 device is selected.
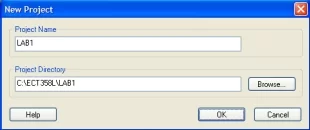
- Create a new directory (folder) ECT358L off the root C:\ drive with a new subdirectory
LAB1 (C:\ECT358L\LAB1). - From the “Project” menu select the “New” option to create a new project titled “LAB1”
and browse to the new folder created in step 8, as shown in Figure 9.
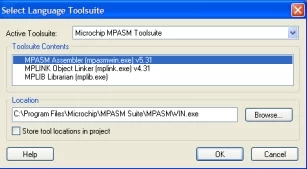
- From the “Project” menu select the “Select Language Toolsuite…” option to choose the
MPASM tool suite as shown in Figure 10. This tool suite will provide the necessary
assembler to provide the PIC18 instructions needed for programming.
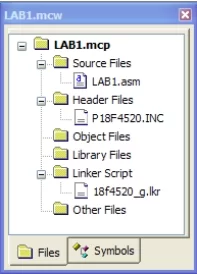
- Add the source file provided on the course website to project (LAB1.asm) under the
“Source Files” virtual project folder. It is a good idea to keep all project files together in
the same directory (folder) under C:\ECT358L. Also add the “P18F4520.inc” header file
from the c:\Program Files\Microchip\MPASM Suite\ directory. Note that the source files
end in *.asm and include files are *.inc. The project file structure should look like that
shown in Figure 11 (the linker script shown, 18f4520_g.lkr, is not needed and will be
discussed later).
- Open the “P18F4520.inc” header file to see all of the specific constants and Special
Function Registers (SFRs) defined for the PIC18F4520 microcontroller (this will be gone
over in more detail in later labs). - With all needed files added to the project, build the project by selecting the “Make”
option under the “Project” menu, by pressing F10, or by selecting the button on the
toolbar. Make sure the build configuration is set to “Debug” and not “Release” as shown
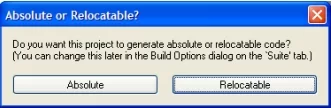
in the toolbar. - A window will pop-up asking if the code should be generated as absolute or relocatable.
Select the “Absolute” option as shown in Figure 12.
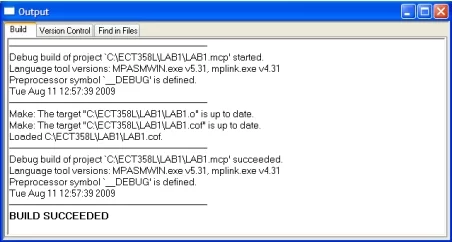
- The output window within the MPLAB IDE will show list all actions being executed by
the “Make” operation and the concluding result should be “BUILD SUCEEDED” ads
shown in Figure 13.
MPLAB Project Debugging using Simulator
- A debugger must be selected in order to test the project code. From the “Debugger”
menu select the “Select Tool” option and pick item “4 MPLAB SIM” to use the simulator
for debugging the project. - Before a program is run it should be placed into the reset state by pressing F6 or selecting
the button from the toolbar. This will move the program counter to the start of the
program. - Start running the program by pressing F9 or by selecting the button from the toolbar.
When the program is running the bottom of the MPLAB window will have a message
“Running” along with a green moving fill bar. - A running program can be halted by pressing F5 or by selecting the button from the
toolbar. - The program can be “Animated” by selecting the button on the toolbar. When in
animation mode a green arrow will move through the source code window, pointing to
the current instruction being executed by the simulator. To manually step through the
program use the “Step Into” option by pressing F7 or selecting the button from the
toolbar. This will execute a single line of code then move to the next line of code to be
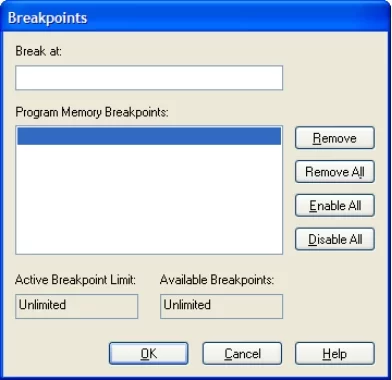
executed. - Breakpoints can be added to a program to halt execution at a particular location.
Breakpoints can be added by pressing F2 or selecting the button from the toolbar to
open the breakpoint management window, shown in Figure 14. Breakpoints can also be
added manually to the program by double-clicking on any line of code to either add or
remove a breakpoint. Each line with a breakpoint will be indicated by a red circle in the
left margin.
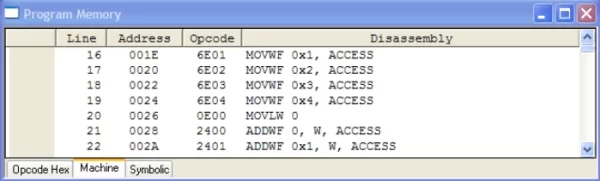
- Program and data memory location can be viewed in debug mode. Program memory can
be viewed in a separate window by selecting the “Program Memory” option under the
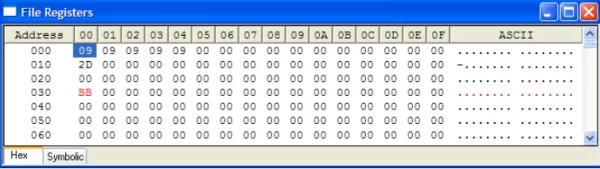
“View” menu and is shown in Figure 15. Data memory can be viewed in a separate
window by selecting the “File Registers” option under the “View” menu and is shown in
Figure 16.
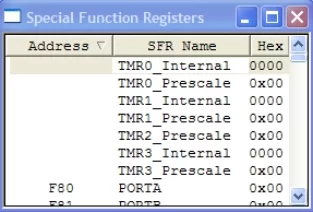
- Users can also monitor the SFRs specifically by selecting the “Special Function
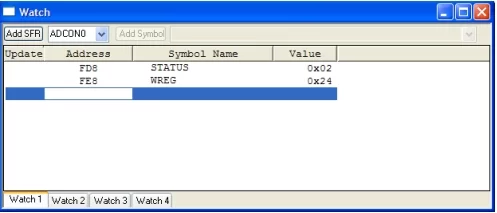
Registers” option from the “View” menu as shown in Figure 17. Finally, users can
monitor specific SFRs and program symbols using a Watch window by selecting the
“Watch” option from the “View” menu as shown in Figure 18.
- The animate operation will allow the user to view the program memory, file registers,
SFRs, or specific symbol values in real-time as the program executes. These values are
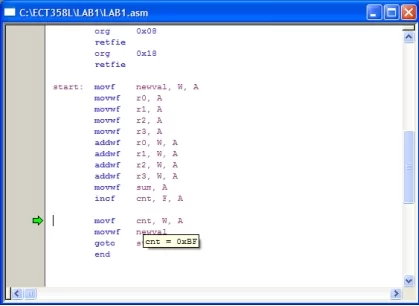
not updated while the simulator is being run without halting first. Furthermore, when the
program is halted or being animated, the current value of a symbol can be read by
hovering over the symbol name in the code as shown in Figure 19.
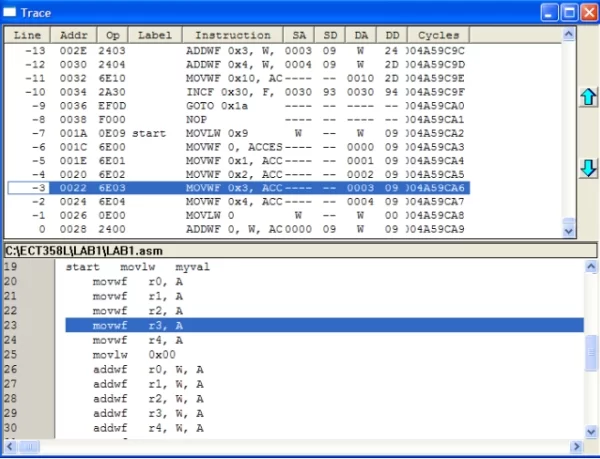
- A simulator trace can be performed as shown in Figure 20. To run a simulator trace,
select the “Simulator Trace” option from the “View” menu. This window will show the
raw instruction in program memory along with the original associate assembly code.
Source: ECT358L – Microprocessors II Laboratory Setting up and Using the Microchip MPLAB IDE
- How do I start the MPLAB installation process?
Extract the MPLAB_IDE_8_33 folder and select the Install_MPLAB_8_33.exe file. - Should I install the HI-TECH C compiler?
No, you should select the No option because the Microchip C18 compiler will be used instead. - Which device must be selected in the Configure menu?
The PIC18F4520 device must be selected from the Select Device window. - What tool suite is required for programming PIC18 instructions?
The MPASM tool suite must be selected from the Project menu. - How do I ensure the build configuration is set correctly?
The build configuration must be set to Debug and not Release. - Which option should be chosen when generating code assembly settings?
The Absolute option should be selected when asked if the code should be generated as absolute or relocatable. - How can I select the simulator for debugging?
Select the 4 MPLAB SIM option from the Debugger menu under Select Tool. - What key press moves the program counter to the start of the program?
Pressing F6 places the program into the reset state. - How can I view the Special Function Registers?
Select the Special Function Registers option from the View menu. - What does the Simulator Trace window display?
It shows the raw instruction in program memory along with the original associate assembly code.