Summary of Integrating Solar Power: Microcontroller-Based Approaches for Domestic Electricity
Summary: This study implements a microcontroller-based system integrating PV solar energy with domestic supply to reduce grid consumption, featuring battery, current, and temperature sensing. It presents two geyser control methods—dual heating elements or a TRIAC current-limiting circuit—managed by software to switch between grid and solar based on battery level, load, and water temperature. Prototypes and tests show PV can maintain geyser temperature and reduce grid energy use, with operational algorithms, hardware layouts, and measured performance provided.
Parts used in the Geyser and Load Controller Project:
- Microcontroller (Arduino ATmega2560 / ATmega2550 referenced)
- Rooftop solar panels (two 100 W panels, 200 W total shown)
- 12 V, 100 Ah battery
- MPPT solar charge controller (40 A / 30 A MPPT referenced)
- Cotek SK1000-212 inverter (DC to AC inverter)
- Current transformer (CT) for output current sensing
- Current sensor circuit components (33 Ω resistor, CT)
- Battery level sensing circuit (1 W 9.1 V Zener diode and resistor R1)
- Dallas temperature sensor (for geyser water temperature)
- Relay board (multiple relays for switching sources and elements)
- TRIAC-based dimmer/current control circuit (switched TRIAC)
- Two water-heating elements (high-power and low-power elements option)
- LCD display (to show battery, load, and status)
- Wiring: high-current DC cables, CAT5 for sensor signals, AC output cables
- NI myRIO data acquisition card and LabVIEW (for energy logging)
- Indicator lamps (two 3 W lamps for status indication)
Abstract:
Microcontrollers have found extensive application in endeavors aimed at reducing power consumption. The availability of microcontroller development tools has made them easily accessible. Many nations grapple with energy challenges such as insufficient power capacity and escalating energy demands. Consequently, it becomes imperative to introduce innovative methods to decrease reliance on the national grid and supplement energy sources with alternatives.
This study employs microcontrollers to monitor household equipment energy consumption and make decisions regarding energy sourcing based on power demand and available solar energy. Additionally, a specialized circuit was devised to regulate geyser power, aligning it with renewable energy source capacity. This geyser control circuit integrates a Dallas temperature sensor and a TRIAC circuit to manage output current drawn from a low-power, renewable energy source.
Alternatively, two heating elements may replace the TRIAC circuit. The first element, powered by solar energy, maintains water temperature and conserves energy. The second element, connected to the national grid, facilitates initial heating, thereby reducing water heating time.
The approach involves augmenting a geyser with a programmed microcontroller-based control circuit and a low-power or current-controlled element. This setup allows for the utilization of photovoltaic (PV) energy to offset geyser energy consumption from the domestic electricity source during idle periods. The integration of a microcontroller, current sensor, battery level sensor, and relay board enables the incorporation of solar-based renewable energy into the commercial energy supply.
1. Introduction
Microcontrollers have found extensive application in endeavors aimed at reducing power consumption. The availability of microcontroller development tools has made them easily accessible. Many nations grapple with energy challenges such as insufficient power capacity and escalating energy demands. Consequently, it becomes imperative to introduce innovative methods to decrease reliance on the national grid and supplement energy sources with alternatives.
This study employs microcontrollers to monitor household equipment energy consumption and make decisions regarding energy sourcing based on power demand and available solar energy. Additionally, a specialized circuit was devised to regulate geyser power, aligning it with renewable energy source capacity. This geyser control circuit integrates a Dallas temperature sensor and a TRIAC circuit to manage output current drawn from a low-power, renewable energy source.
Alternatively, two heating elements may replace the TRIAC circuit. The first element, powered by solar energy, maintains water temperature and conserves energy. The second element, connected to the national grid, facilitates initial heating, thereby reducing water heating time.
The approach involves augmenting a geyser with a programmed microcontroller-based control circuit and a low-power or current-controlled element. This setup allows for the utilization of photovoltaic (PV) energy to offset geyser energy consumption from the domestic electricity source during idle periods. The integration of a microcontroller, current sensor, battery level sensor, and relay board enables the incorporation of solar-based renewable energy into the commercial energy supply.
2. Similar Studies
Previous studies have examined the electrical energy consumption from commercial sources to support consumption regulations. A survey was conducted to analyze the electricity usage patterns of small and medium enterprises, with the goal of promoting mindful electricity consumption through campaigns, increased energy prices, and rebates for reduced consumption. Other researchers explored the utilization of legislation to regulate energy consumption from the national grid. ISO 50001 serves as the standard governing the use of supplied energy. Ineffectiveness in electricity usage was investigated for a municipality, where various legislation for regulating energy consumption was outlined.
This research aims to promote a reduction in energy consumption from the national grid. However, instead of relying solely on legislation, a technical solution is proposed whereby solar energy is integrated to supplement grid supply. The study seeks to unify multiple aspects to enable the simultaneous use of both renewable energy sources (RES) and domestic electricity supply. The microcontroller continuously monitors parameters such as battery level, water temperature, and load current, which in turn influence the choice of electrical energy supply source. While individual studies discussed in this section may cover fewer aspects, collectively, they address a broader spectrum of issues.
- Microcontrollers and Energy Management in PV Systems
In a study conducted by other researchers, an embedded low-cost microcontroller-based logger was devised for PV systems. They utilized an Arduino microcontroller to regulate module activities, incorporating current sensors, temperature sensors, and analog-to-digital converters interfaced via various protocols. This prototype boasts 18-bit resolution and offers eight analog inputs capable of measuring up to eight photovoltaic modules within an array or string. Current measurements can be either DC or AC, with shunt resistors employed for detection.
Similarly, another group of researchers achieved remote monitoring of PV currents by employing a hall current sensor interfaced with an Arduino board. They utilized Zigbee-based communication to transmit data to a receiving system equipped with a LabVIEW-based application. Data is received via the USB port connected to the wireless signal circuit, enabling the monitoring of 1.5A ADC currents.
In another instance, researchers developed a system employing a microcontroller to disconnect a load exceeding a predefined limit of 500W. This system also provides protection for generators against excessive load currents. Relays driven by NPN transistors are utilized for switching, while a current transformer facilitates current detection.
Another unit was designed to alternate load connections between a generator, PV energy source, and domestic utility. ATMEGA16L utilizes a relay board to select the appropriate supply based on availability, with a LCD screen included to display the status.
A home energy management system was employed to switch DC and AC load connections between an installed PV system and utility supply. A mathematical approach was utilized to formulate the prediction algorithm.
Exploring home automation based on DC load-matching techniques, researchers investigated strategies to eliminate DC–AC and AC–DC converters to minimize losses.
Furthermore, a battery management system based on the Internet of Things (IoT) was discussed, wherein a Raspberry Pi model 2 gathers battery and PV information and transmits it to a cloud for distribution. Various sensors are employed by the Raspberry Pi to acquire temperature, voltage, and currents, allowing access to acquired data through computers and mobile devices via cloud database connection.
Lastly, a switching system between the grid and PV system was implemented using the PIC16F877 microcontroller. Automatic switching is employed to prevent battery over-discharge, with the switching circuit comprising a Darlington pair transistor configuration and a relay. Testing of the prototype utilized a 3-W photovoltaic panel, generating an output voltage of up to 10.5V.
- Strategies of Supple menting Grid Power with PVE nergy and to Control Electric Water Heater(Geyser) Power Consumptions
One study employed a microcontroller to create a water heater that operates using both solar energy and domestic power supply. An electric heater is activated when solar radiation diminishes, and the installed thermostat regulates the water temperature to its highest setting. The microcontroller streamlines this process and manages the functions of the circulation pump.
Another project, undertaken by experts, devised an AC–DC hybrid and PV generation system with battery backup, utilizing a smart grid approach to ensure continuous electricity supply in a cost-effective manner. The system’s algorithm assesses the availability of solar energy and switches to it whenever it can meet the required capacity; otherwise, it relies on local power supply. Additionally, the system forecasts weather conditions and reschedules high-power consumption tasks to periods of high energy production, maintaining backup batteries at a charge level exceeding 50 percent.
Furthermore, a demand response strategy outlined in another study highlights the substantial energy consumption attributed to thermal loads from the grid. Mismanagement of these thermal loads can lead to overloading, especially when numerous loads operate simultaneously. To address this issue, the study incorporates information and communication technologies to harness the potential of renewable energy sources.
- Novelty and Contribution
While microcontrollers have been previously utilized for various applications, such as grid-PV switching [31], battery management systems [30], and solar tracker development [9], this study presents a novel approach. In addition to facilitating the transition between domestic and PV energy sources, our research introduces a specialized circuit designed to regulate geyser power in alignment with renewable energy capacity. Two methods were employed to manage geyser current: the first method involves the microcontroller selecting between two types of heating elements based on available energy sources, while the second method utilizes a Triode for Alternating Current (TRIAC) circuit in the geyser control circuit to regulate output current from a low-power, renewable energy source during operation. Consequently, our contribution extends to the development of a programmed microcontroller-based control circuit catering to high-current and low-current geyser heating profiles. In this study, PV energy was leveraged to conserve energy when the entire domestic power demand aligns with available solar resources.
3. Objectives
The objectives of this research are:
• Prototyping and testing a microcontroller-based electric water heater (geyser) that integrates both PV and domestic energy sources. We suggest two approaches: the first involves employing two heating elements, with each element’s size determined by the capacity of its respective energy input. The second approach entails incorporating a current-limiting circuit to regulate current as needed.
• Prototyping and testing a microcontroller-based circuit designed to alter the connection between PV-generated energy and domestically supplied energy, contingent upon energy supply availability and load consumption levels.
4. Methods
- Hardware Components
In Figure 1, a rooftop solar array generating a 200 W output is depicted. The output current from the solar panels charges a 12V, 100 Ah battery through a 40 A solar charge controller identified as MPPT (maximum power point tracker). The charge controller oversees the charging process. At the input of the microcontroller, three sensors are connected: a current sensor for load management, a battery level sensor for determining connection and disconnection from RES, and a Dallas temperature sensor for monitoring geyser water temperature. Several outputs from the microcontroller are linked to the relay circuit, as depicted in Figure A1. As detailed in Section 1, the software in Appendix B is utilized to regulate the relay circuit outputs.
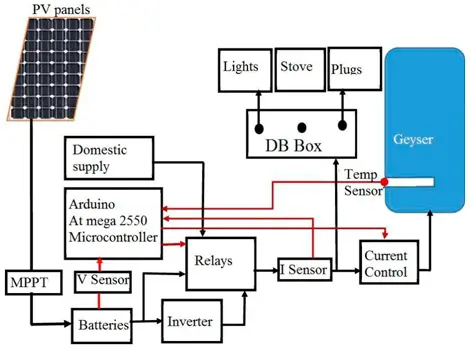
The system incorporates three primary sensors: a battery level sensor, an inverter-output current sensor, and the Dallas temperature sensor for water temperature monitoring. A maximum charge current of 16 A has been recorded. Assuming the software prevents the battery level from falling below 50% of its maximum capacity (50Ah), it would take approximately 3 hours to fully recharge the battery to its maximum level. With 16 A producing about 50 Ah in approximately 3 hours of sunshine, accounting for about six peak-sun hours, a fully charged 12 V battery can supply the load for approximately 1 hour at a maximum load power of 600 W from a PV source.
In this scenario, the system charges the battery for 3 hours to sustain continuous energy for 1 hour, potentially resulting in domestic electricity savings of about 1 kWh per day, influenced by available sunshine duration. To achieve greater savings, one must consider increasing the size of solar panels, battery capacity, and a charge controller.
If the load requires approximately 120W to operate and the system in Figure 1 is utilized for backup power, it can operate for roughly 10 hours while still saving 1 kWh of energy per day.
A schematic diagram (Figure A1) illustrates the overall circuit discussed, excluding sensors mentioned in previous sections. Additionally, Figure 2 displays the LCD used to monitor the load controller status and activities.

The LCD display indicates that the battery level capacity stands at 55.9%, the equipment utilizes only 110W of solar power, and the status is designated as “SOLAR,” indicating the availability of solar energy. The LCD screen can show three statuses: charging, idle, and solar (PV usage).
- Battery Level Sensing
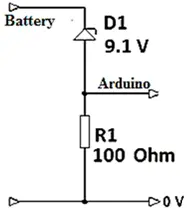
Upon initialization, the microcontroller performs a battery level check by measuring the voltage across the current-limiting resistor (R1) as depicted in Figure 3. In this setup, a 1W, 9.1V Zener diode is utilized. The Arduino ATmega2550 microcontroller’s analog-to-digital converter operates within a maximum range of 5V with a 10-bit resolution. Despite a fully charged battery typically providing about 12.7V, employing this sensor allows the microcontroller to withstand voltages up to a maximum of 14.1V (9.1V + 5V) across the battery.
An inverter, specifically a Cotek SK1000-212 with detailed specifications outlined in [36], is employed. According to its specifications, this inverter functions effectively within the voltage range of 10.5V to 15V. To prevent excessive battery discharging, the minimum battery level is set at 12.1V, which represents 50% of its maximum charge capacity. Whenever the voltage level at the microcontroller’s analog-to-digital converter input drops below 3V (12.1V – 9.1V) or lower, indicating low battery levels, the microcontroller redirects the load to the domestic electricity supply to avoid further battery drainage.
- Output Current Sensing
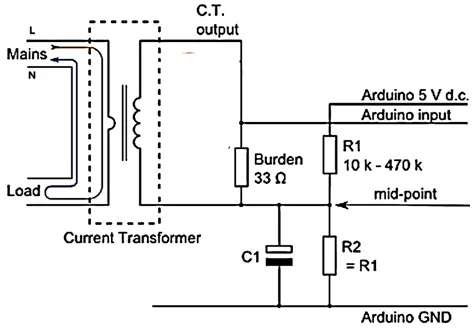
A circuit depicted in Figure 4 was utilized to detect high load current, employing the current transformer (CT) as depicted. The current transformer utilized can deliver a maximum of 141mA peak-to-peak output current through the 33 Ω resistor.
Applying Ohm’s law, this translates to a maximum peak-to-peak voltage of 4.65V applied to the input of the microcontroller. With the 1000W inverter utilized and excluding any form of calibrations, the maximum output power was restricted to 600W at a 230V output, resulting in a peak-to-peak current of 7.379A. The CT current ratio is 100A: 50mA.
Hence, a peak-to-peak current of 7.379A will produce 3.689mA through the load. By utilizing Ohm’s law, this results in a peak-to-peak voltage of 3.689mA × 33Ω = 121.764mV. The microcontroller will suspend any connections to the PV energy source and connect all loads to the commercial electricity supply after reading 121.764mV or higher.
- Geyser Water Temperature Sensing
For this research, a temperature probe and connection diagram, as detailed in [38], served as a reference for water temperature detection. Prior to utilization, it is necessary to obtain the software library from an open-source platform. This library software is subsequently incorporated as a header file in the source code (refer to Appendix B). Within the source code, the sensor undergoes initialization to facilitate temperature readings. Additionally, the existing geyser thermostat can provide supplementary protection; however, it must be adjusted to a slightly higher value than the maximum preset cut-off temperature of the sensor outlined in [38].
- Controlling Geyser Element Current
Considerable attention was focused on geysers due to their substantial energy consumption. This study demonstrates that geysers can be configured to draw high current solely for heating water when the temperature is below a predefined threshold, then utilize less current to further raise water temperatures. Previous findings have already indicated significant energy savings by reducing geyser connection time to the domestic electricity supply.
Rather than completely disconnecting geysers from the power source, this research proposes reducing their power consumption and subsequently connecting them to a low-power PV energy source. This approach further enhances domestic energy savings as water temperatures gradually increase to even higher levels. Two methods were evaluated for achieving this: utilizing two elements or employing a TRIAC-based circuit resembling a high-power light dimmer. Various low-power light dimmers are discussed in [39].
- Using Two Water-Heating Elements
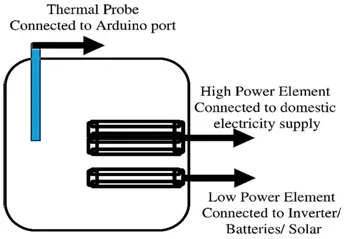
In Figure 5, two components are employed. The low-power element can be directly connected to the batteries or DC to AC inverter output, but not directly to the solar panels. The high-power element functions to elevate water temperature from its lowest point to 50°C. Subsequently, the low-power element ensures the water remains warm by further increasing its temperature to 72°C.
To achieve this, the microcontroller reads the temperature sensor. If the water temperature falls below 50°C, it connects the high-power element to the domestic electricity supply to raise the temperature to the desired level. Once the water reaches 50°C, the microcontroller assesses the battery level indicated in Figure 1. If the battery level exceeds 50%, it maintains the water temperature by linking the low-power element to the renewable source until the battery level drops just below 50% or the water temperature reaches approximately 72°C.
When the battery level falls below 50%, the low-power element remains inactive until the battery recovers to a level of 75%. This cycle of battery charging and water heating continues until the water temperature reaches 72°C. At this point, all geyser elements are disconnected from their respective energy sources to prevent overflow. In the event of a drop in water temperature below 50°C during the battery charging phase, the high-power element takes over.
- Using TRIAC Circuit to Control Geyser Current
Figure 6 depicts the utilization of a unique switched TRIAC circuit for managing geyser current. A TRIAC serves as a component capable of regulating output current through the manipulation of its on/off cycles.
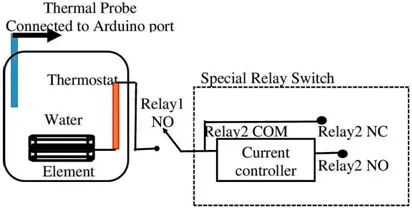
This configuration is particularly compatible with conventional geysers, as it necessitates minimal modifications to them. The variance between the operations elucidated in Section 4.1.4.1 and the setup illustrated in Figure 6 can be summarized as follows:
• Employment of a single element instead of two.
• Implementation of a current control circuit to manage current from the source.
• Utilization of Relay 1 to deactivate all elements.
• Configuration of Relay 2 with a normally closed (NC) contact connecting to the national grid, while the normally open (NO) contact connects to the renewable energy source.
- Software Component
The Geyser and load controller, each operating as independent circuits responsible for switching between solar energy and the national grid supply, underwent separate testing using distinct software, as illustrated by the forthcoming flowcharts to be discussed. Appendix B provides comprehensive source code utilized for geyser operations. Given the substantial similarity between the software governing both the load and geyser control, it is deemed unnecessary to include both sets of source codes. In essence, the source code can be structured to encompass a main program capable of invoking either the geyser control or the load controller’s software algorithm. Consequently, the source code in Appendix B can be reconfigured into a function.
- Geyser Controlling Software
The depicted flowchart in Figure 7 utilizes electricity from the national grid to initially heat the water temperature to 50°C. Subsequently, it switches to solar energy to maintain the water temperature within the range of 50°C to 72°C.
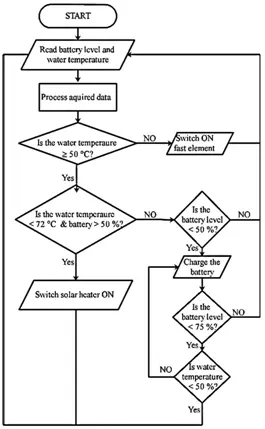
Upon initialization, the software retrieves data from both the battery and temperature sensors. These acquired readings are then processed into meaningful data, which is subsequently utilized for decision-making purposes. If the water temperature falls below 50°C, conventional electricity is activated to heat the water until it reaches this threshold. Subsequently, renewable energy is employed to further heat the water if the battery level remains above 50% and the water temperature is below 72°C. Should the battery level decline to below 50% while the water temperature remains above 50°C, the renewable energy source is disconnected to enable battery recovery by charging it up to 75% capacity. In the event that the water temperature drops below 50°C during the battery recovery process, the mains electricity is engaged to raise the water temperature back to 50°C. Additionally, a geyser thermostat is integrated to prevent overflow. It is worth noting that connecting the mains electricity to the element during the charging phase does not interfere with the battery recovery process, as the batteries are consistently linked to the PV system via maximum power point trackers (MPPT).
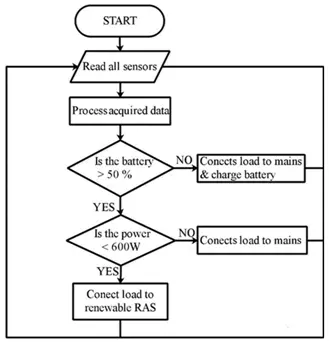
- Load Controlling Software
Figure 8 illustrates the software algorithm employed for toggling load connections between the renewable energy source and the national grid power. In this context, it is essential to note that the battery charge level must surpass 50%, and the connected load should not surpass 600W for the renewable energy source to be engaged. The national grid power is assigned the lowest priority, signifying that renewable energy serves as the primary energy source, with the national grid power acting as a backup.
5. Results
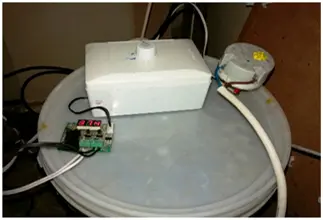
- Performance of the Geyser Prototype
The experiments were carried out utilizing a geyser prototype depicted in Figure 9, following the connections outlined in Figure 6. In cases where a low-power element isn’t accessible, a high-power element can serve as a substitute. The circuit incorporating a TRIAC regulates the current, while geyser operations are controlled by the microcontroller. The software algorithm depicted in Figure 7 is also applicable to a two-element system, as indicated by the connections shown in Figure 6.
-
Results Obtained When Both PV Energy and Grid Energy are Used
The energy consumption data presented in this section were recorded using a custom-built energy logger employing an NI myRIO data acquisition card programmed with LabVIEW development platform. Further details on logging and tracking renewable energy using this tool can be found in [40]. As depicted in Table 1, 140 Wh of energy from the domestic electricity supply was utilized to raise the initial geyser water temperature from 27°C to 50°C over a duration of 7 minutes. Solar energy maintained the water temperature above 50°C from 08:07 to 18:48. Occasionally, low-power heating coincided with battery levels dropping below 50% due to high DC currents of up to 30 A drawn from the battery, albeit never lasting longer than the software delays. Another challenge was obtaining accurate battery voltage readings (utilized to determine battery charge level) while the load was actively connected. Nevertheless, a battery level below 50% was not permitted under any circumstance.
The geyser water temperature was sustained using PV power to gradually increase it to 72°C. At a water temperature of 72°C, all power sources were disconnected. Table 1 also indicates that PV energy was only able to maintain the water temperature at around 72°C from 11:00 to 16:33. After 16:33, with insufficient sunlight, the water temperature declined from 72°C to below 50°C, prompting a reconnection to the national grid power at 18:48. A five-hour power saving can be calculated by examining the time span from 09:05 to 14:06 in Table 1, resulting in approximately 10 Wh saved (160 Wh − 150 Wh). A battery level dropping below 50% occurred around 16:33; it’s important to note that even though the geyser ceased drawing current from the battery, a DC to AC inverter remained active to power the instruments, further depleting the battery charge.
Table1.Samplevalues that highlight the geyser performance during the presence of both national grid energy and solar energy.
| Time | Temperature | Battery (%) | Energy (Wh) | Status |
| 07:59:41 | 27 | 71.69 | 0 | High Power Heating |
| 08:07:17 | 50 | 87.39 | 140 | Low Power Heating |
| 08:07:19 | 50 | 85.94 | 140 | Idle |
| 08:07:21 | 50 | 83.44 | 140 | Low Power Heating |
| 09:05:02 | 65 | 29.99 | 150 | Low Power Heating |
| 11:04:40 | 73 | 39.5 | 150 | Battery Charging |
| 11:12:08 | 70 | 65.11 | 150 | Idle |
| 11:12:09 | 70 | 69.51 | 150 | Low Power Heating |
| 11:40:06 | 73 | 46.57 | 150 | Battery Charging |
| 11:41:09 | 72 | 65.28 | 150 | Idle |
| 1143:52 | 73 | 42.88 | 150 | Low Power Heating |
| 11:45:43 | 72 | 65.11 | 150 | Battery Charging |
| 11:45:46 | 72 | 65.45 | 150 | Idle |
| 11:50:59 | 73 | 51.2 | 150 | Low Power Heating |
| 11:55:02 | 71 | 65.62 | 150 | Battery Charging |
| 12:09:26 | 72 | 52.45 | 150 | Low Power Heating |
| 12:11:33 | 72 | 65.45 | 150 | Battery Charging |
| 12:12:57 | 73 | 44.34 | 150 | Low Power Heating |
| 12:16:31 | 71 | 66.97 | 150 | Battery Charging |
| 12:26:57 | 72 | 46.21 | 150 | Low Power Heating |
| 12:28:14 | 72 | 65.28 | 150 | Battery Charging |
| 14:06:01 | 72 | 51.2 | 160 | Low Power Heating |
| 16:33:00 | 72 | 41.69 | 160 | Battery Charging |
| 18:48:00 | 50 | 39.5 | 160 | Battery Charging |
| 18:48:45 | 49 | 39.66 | 160 | High Power Heating |
| 18:48:55 | 49 | 39.5 | 170 | High Power Heating |
| 18:49:09 | 50 | 39.33 | 170 | Battery Charging |
- Results Obtained When PV Energy Is Not Available
As shown in Table 2, the national grid power was utilized to raise the water temperature from 28°C to 50°C and sustain it at 50°C from 09:13 until 14:06. The water temperature was observed to decrease by approximately 1°C every 20 minutes, necessitating the geyser to be activated whenever the temperature dropped to 49°C. Consequently, energy consumption increased incrementally. According to Table 2, a total of 130 Wh (230 Wh − 100 Wh) of energy was drawn from the national grid source to maintain the water temperature at 50°C between 09:13 and 14:06. The test procedure was concluded prematurely to prevent excessive energy consumption.
| Time | ◦
Water Temperature(C) |
Energy (Wh) |
| 09:05:25 | 28 | 10 |
| 09:13:15 | 50 | 100 |
| 09:30:01 | 50 | 110 |
| 09:30:03 | 50 | 110 |
| 10:00:03 | 50 | 120 |
| 10:30:00 | 49 | 140 |
| 11:00:03 | 50 | 150 |
| 11:30:05 | 50 | 160 |
| 12:00:00 | 50 | 170 |
| 12:30:01 | 50 | 190 |
| 13:00:03 | 50 | 200 |
| 13:30:03 | 49 | 210 |
| 14:06:01 | 50 | 230 |
- Load Controller Performance
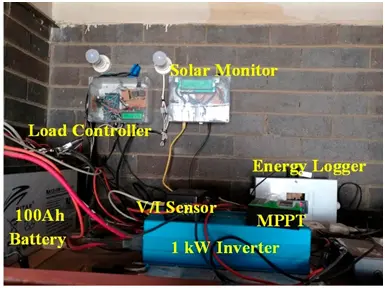
Figure 10 depicts a PV system comprising a DC to AC inverter, real-time solar power consumption monitoring unit, solar charge controller, energy logging device, Arduino-based load controller, relay board, two 3-W indicating lamps, and a solar current/voltage sensor. Three sets of wiring cables were utilized: wires carrying large DC current from the battery and solar panels, CAT5 network cable for signals from sensors, and AC output current cables.
- Results Obtained When PV Energy Is Incorporated to Domestic Electricity Supply
As previously detailed, the solar renewable energy system comprises two 100W PV panels installed on the rooftop, a 100Ah battery, a 1kW inverter, a 30A power point tracker (MPPT), a custom-built solar monitor displaying real-time power generated by the solar panels and the ambient temperature of the roof, along with a custom-built energy logger. On a sunny day, as depicted in Figure 10, the system is observed to be active from 11:30 to 14:30. The input solar power was recorded to a maximum of 200W, with the output AC power ranging between 150W and 500W. It’s important to note that the system never permits power levels above 600W, as discussed earlier. If this threshold is exceeded, the system automatically connects the load to the national grid power.
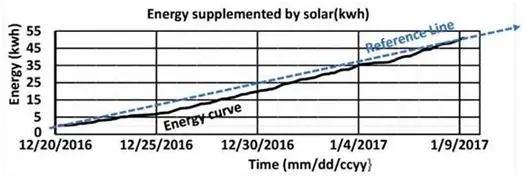
In Figure 11, it can be observed that most points of consumed electrical energy do not coincide with a virtual line referred to as the “reference line.” This reference line represents the power that can be continuously accumulated without any disconnections. The actual energy curve falls below it. Therefore, the space between the two lines indicates the amount of energy savings achieved.
- Results Obtained When Solar Is Not Included
- How does the system decide to use solar or grid power?
The microcontroller reads battery level, load current, and water temperature and selects solar when battery >50% and load ≤600W; otherwise it uses grid power. - Can the geyser be run on low-power solar only?
Yes, the system can switch the geyser to a low-power element or TRIAC-controlled current from the PV source to maintain temperature when battery level permits. - What sensors are used to manage switching?
A battery level sensor, an inverter-output current sensor (via CT), and a Dallas temperature sensor are used. - Does the system prevent battery over-discharge?
Yes, the software prevents using PV if battery voltage indicates below 50% state of charge and reconnects to grid until battery recovers. - What methods are proposed to control geyser power?
Two methods: using two heating elements (high-power and low-power) or using a TRIAC-based current control circuit. - How is the battery level measured safely by the microcontroller?
Battery voltage is measured across a circuit with a 9.1V Zener diode so the ADC input stays within the microcontroller 0–5V range. - What condition forces switching back to grid for loads?
If measured load exceeds 600W or battery level falls below the software threshold, the microcontroller connects loads to the national grid. - Can the existing geyser thermostat still be used?
Yes, the existing geyser thermostat provides supplementary protection and should be set slightly higher than the sensor cut-off temperature. - Does the system log energy performance?
Yes, energy logging was performed using an NI myRIO data acquisition card with LabVIEW to record consumption and PV contribution. - What display statuses are shown on the LCD?
The LCD shows charging, idle, and solar (PV usage) statuses along with battery percentage and solar power used.