
Summary of Spectrum analyzer based PIC18F4550
The article describes a real-time sound spectrum analyzer built around a PIC18F4550 microcontroller using a C-implemented FFT to visualize audio on a 128×64 graphical LCD. It samples at 20 kHz, analyzes 312 Hz–10 kHz, and updates at 10 frames per second. Input audio is amplified and DC-shifted (LM386) to use the ADC 0–5 V range, mixed from stereo, smoothed with a 10 kHz RC filter, and displayed via a KS0108-based ATM12864D. Software handles ADC sampling, a 16-bit FFT, and display/control routines.
Parts used in the Spectrum analyzer based PIC18F4550:
- PIC18F4550 microcontroller
- Graphical LCD ATM12864D (KS0108B / KS0107B controller)
- Audio amplifier LM386-1
- LM7805 voltage regulator
- Stereo input connector J4
- Mixing resistors R1 and R2 (10k each)
- Potentiometer R3
- RC low-pass filter (10 kHz) components (resistor and capacitor)
- Three indicator LEDs
- Two push buttons SW1 and SW2
- Through-channel connector J5 (headphones)
- Programmer connector J2 (for in-circuit programming)
- Printed circuit board (single-sided)
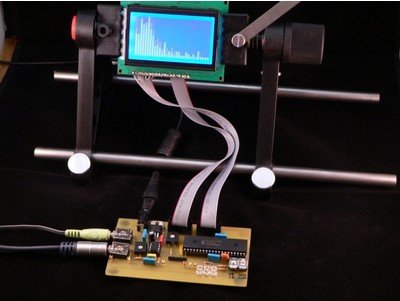
The project demonstrates the implementation of the sound spectrum analyzer for 8-bit microcontroller PIC18F4550 manufactured by Microchip . Spectrum analysis is performed using an optimized fast Fourier transform algorithm (Fast Fourier Transformation, FFT), written entirely in C language. Data Visualization (spectrum) is carried out in real time on a graphical LCD display with a resolution of 128 × 64 pixels.
Key Features:
- sampling rate 20 kHz;
- frequency range 312 Hz – 10 kHz;
- the display speed of 10 frames per second;
- display resolution of 128 × 64 pixels;
To calculate the values of the fast Fourier transform algorithm in the range of sound frequencies necessary to prepare the signal for further processing microcontroller. PIC18F4550 has an integrated multi-channel ADC, which can be used to measure voltage in the range 0 V – 5 V with 10-bit resolution (0-1023).
The main characteristics of the microcontroller:
- core PIC18, the operating frequency to 48 MHz;
- 32 KB Flash-memory programs;
- 2 MByte RAM;
- one 8-bit timer, three 16-bit timers;
- USB interface, SPI interface;
- 13-channel 10-bit ADC;
- 35 I / O lines for general use.
Audio signal from audio line-out is an alternating signal wave with an amplitude of about 1 V. The lower oscillogram clearly shows the sinusoidal tone frequency of 5 kHz (reference point on the chart W2 ).
If such a file directly to Segal ADC of the microcontroller, we get only a small range of input voltage (0 V – 0.5 V), ie we obtain the values of only the top of the wave and the calculation of FFT algorithm will be incorrect.
In order to get the correct calculations, we need over the original signal to do some action. First you need to amplify the signal in order to use the entire working range of the ADC of the microcontroller (0 V – 5 V). In the second stage, we need to shift the signal at 2.5 V (“virtual” 0) to the ADC can capture all the values of the analog signal. Thus, the microcontroller will be able to do sampling positive and negative half-wave signal.
To this end, the device used a simple on-chip amplifier LM386-1 – we solve the first condition – the signal gain. Nutrition amplifier is +5 V, and because of this, we perform the second condition – positive offset signal. With the same purpose is permissible to use rail-to-rail operational amplifier (op amp output signal c scale, equal to the voltage supply).
Oscillogram below shows the shape of the signal after the amplifier LM386-1 (control point on the chart W3 ).
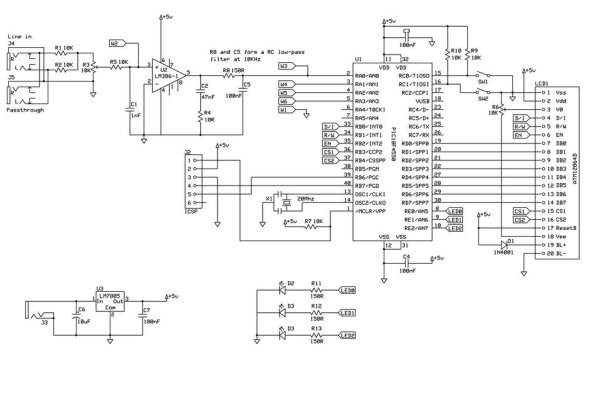
The device has a stereo input J4, but with two resistors (R1, R2) par 10k done mixing the two signals. With the potentiometer R3 is possible to regulate the amplitude of the signal. The output signal from the amplifier passes through a simple RC filter is 10 kHz, and the resulting signal to the input of the ADC of the microcontroller.
RC filter 10 kHz in our case used as a filter of “smoothing” for the FFT, which can not correctly detect a signal with a frequency above 10 kHz. It is worth noting: RC filter – the filter is simple and very inefficient, but this type of filter was chosen because of ease of implementation, since required all two passive elements. Users can replace this part of the scheme, such as a filter using the operational amplifier.
To display the data using a graphical LCD display ATM12864D , one based on the controller and KS0108B KS0107B. The display connects directly to a microcontroller with 8-bit bus. In addition there are three LEDs, which are used in the test mode conversion, “music-light.” Two buttons SW1 and SW2 are used to switch display modes. The second connector J5 is designed to implement the through channel (eg, headphones). J2 connector is designed to connect the programmer and in-circuit programming of the microcontroller. To supply schemes applied voltage regulator LM7805 .
The developed one-sided printed circuit board is designed for use and installation of components with pin terminals.
However, a schematic diagram of the device is not complicated and can collect it on the breadboard. Possible to use another microcontroller, software compatible with the PIC18F4550 (for example, PIC18F2550 ).
Schematic diagram and printed circuit board (format and expressSCH expressPCB) – download
In the second part of this article, we look at the highlights in the software of the microcontroller.
In the first part Spectrum analyzer based PIC18F4550. Part 1, we met with the scheme, with the appointment of individual nodes and elements, over the principles of operation.
Microcontroller software is written entirely in C language, and it can be conditionally divided into 4 parts.
1. ADC sample data (sampling)
Implementation of sampling analog-digital converter is the channel every 50 ms RA0. This gives us a sampling frequency of 20 kHz (20,000 times per second). For the Fourier transform is very important that the samples were uniform and accurate. With this purpose in the subroutine get data from ADC introduced a short time delay, which was calibrated using an oscilloscope connected to the control point W4 on the board. Square-wave period as measured in this reference point should be exactly 50 microseconds. ADC works with a full 10-bit resolution, and the results are shifted down to 512 to implement a “virtual earth” input signal. This means that the resulting data will be in the range from -512 to 512, as required for the mathematical transformation FFT.
The procedure for obtaining the samples will take a little time to 32 ms (64 × 50 microseconds) for each cycle.
2. 16-bit FFT
Subroutine, which implements the calculation algorithm FFT, was found on the Web so (link to the original code is in the source code at the end of the article). Math FFT is complex and difficult to understand. The code has been slightly simplified and adapted for the PIC18F4550. Since the microcontroller has a hardware multiplier 8 × 8 as part of its arithmetic and logic devices have been optimized computing, allowing the compiler to correctly use the features of the microcontroller.
For more detail: Spectrum analyzer based PIC18F4550
- What sampling rate does the project use?
The project uses a sampling rate of 20 kHz. - What frequency range can the spectrum analyzer detect?
The frequency range is 312 Hz to 10 kHz. - What display resolution and speed are used?
The graphical LCD resolution is 128 × 64 pixels and the display speed is 10 frames per second. - How is the audio signal prepared for the ADC?
The audio is amplified with an LM386-1 and shifted to a 2.5 V virtual zero so the ADC can sample positive and negative halves. - Why is an RC 10 kHz filter used?
The RC 10 kHz filter smooths the signal for FFT processing and prevents detecting frequencies above 10 kHz. - What ADC resolution and range does the PIC18F4550 provide?
The PIC18F4550 has a 10-bit ADC with a voltage range of 0 V to 5 V (0–1023 counts). - How many samples are taken per FFT cycle and how long does it take?
64 samples are taken with 50 microseconds between samples, taking about 32 ms per cycle. - What FFT implementation is used?
A 16-bit FFT algorithm adapted from public source code and optimized for PIC18F4550 is used. - Can other microcontrollers be used?
Yes, other software-compatible microcontrollers like PIC18F2550 can be used. - How is stereo input handled?
Stereo inputs are mixed using two 10k resistors into one channel.
