Summary of Speech Recognition Eye Test
Summary (under 100 words): A PIC32-based speech recognition Snellen eye test displays letters at descending sizes, records spoken guesses via a microphone and analog band-pass amplifier, and uses energy thresholding, 256-sample FFTs, a 10-bin Mel filterbank, and feature-index matching against a dictionary (A, E, I, R, L) to recognize letters. A FSM adjusts letter size based on correct/guessed thresholds to determine visual acuity (20/20 to 20/200). System uses TFT display, ISR sampling at 8 kHz, fixed-point math, and threads for FFT, speech classification, FSM, and LCD.
Parts used in the Speech Recognition Eye Test:
- TFT LCD display
- Microphone
- High-pass filter components (R2 = 326 Ω, C2 = 169.6 nF)
- Low-pass filter components (R1 = 5.1 kΩ, C1 = 96.2 nF)
- Band-pass amplifier (op amp) with gain resistor Rg = 437 kΩ
- Voltage divider for Vdd/2 bias
- PIC32 microcontroller (with 10-bit ADC)
- Timer 2 for ISR sampling at 8 kHz
- Power supply (Vdd 3.3V logic level)
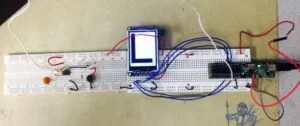
For our final project we implemented a speech recognition eye test that is capable of performing the entire Snellen eye test on its own. It starts by displaying large letters and waits on the user to guess which letter has been displayed. The user speaks his/her guess into the microphone. The speech recognition portion uses energy thresholding to make sure background noise does not interfere with the user’s guess. The system will then determine the next step based on whether the user guessed the displayed letter correctly or not. If the user guesses enough correctly, the text size will continue getting smaller until the user either reaches the minimum text size (corresponding to 20/20) or starts guessing enough incorrectly. If the user guesses too many letters incorrectly, the system will display the result corresponding to the current text size (e.g. 20/30). The thresholds for amount guessed and amount guessed correctly are set in the code. Our eye test uses a dictionary containing the letters “A”, “E”, “I”, “R”, and “L” with the same 6 possible text sizes for each of these letters.
High Level Design
Rationale
The idea is that we want to bring the common Snellen eye test to the household. The test is very simple in that it requires the user to stand a distance away from a chart and read letters to estimate one’s visual acuity. So we thought, why not bring the test from the eye doctor’s office to the household? In this way, people can take the initiative in taking care of their health in a way that does not require having to drive over and wait until it is their turn to complete the test which, in the end, takes a fraction of the time spent driving and waiting. Also, this can reduce the time it takes to receive a proper diagnosis for one’s eyesight when one visits the doctor after having taking the household exam. Also, our eye test could be used in the doctor’s office to streamline the process of determining a person’s visual acuity since so many of these tests are performed each day.
BPF Design
The range of spoken frequencies is 300 Hz to 3400 Hz. This means we only need to worry about frequencies in that range, so we can filter out the rest. We set up our band-pass filter and determined the resistance and capacitance values according to the cutoff frequency equation below. This equation applies to both the cutoff frequency for the low-pass filter and the high-pass filter.
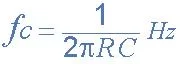
In the above equation, we chose R1 = 5.1kΩ and C1 = 96.2nF for the low-pass filter, while R2 = 326Ω and C2 = 169.6nF for the high-pass filter. Under this setup, the actual cutoff frequencies are 324Hz and 3058Hz respectively.
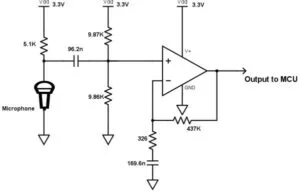
We also set up our band-pass filter amplifier to have a proper gain and DC bias. This is because the output of our microphone circuit is inputted into the ADC of the PIC32, which expects an input in the range of 0 to 3.3V so that the ADC can gain more accuracy. We spoke into the microphone and determined its output alone to be in the range of ±13mV. The equation for the gain calculation is simply: Gain = Rg/R2. As a result, we set Rg = 437kΩ to obtain a gain of 1340 so that the circuit’s output could be in the proper range for the ADC. Some graphs of our band-pass filters output can be found in the appendix. We have a voltage divider applied to the microphone signal to provide a Vdd/2 DC bias before serving as input to the band-pass filter.
Also note that the range of spoken frequencies determines the sampling frequency (8kHz) we used for our project. Since the largest spoken frequency is 3.4kHz, the sampling frequency must to be greater than twice as large as the largest frequency according to the Shannon-Nyquist theorem. This leads to the typical sampling frequency of voice being 8kHz.
Background Math
Energy Sum and Threshold
The first portion of our speech recognition requires determining if a letter has been uttered. This was done by performing a form of energy thresholding. The idea is to accumulate energy at a slow rate so that short, loud, and high frequency background sounds do not tamper with the voice recording. In other words, the energy accumulator acts as a low-pass filter, allowing sounds of significant duration, such as utterances, to be recognized by the PIC32. Once the energy reaches past a specified threshold, the PIC32 starts storing the samples for further processing. At every sample time, we use the following formula to calculate the value of the energy. Note that all the calculations for the energy accumulator were performed in 16:16 fixed point notation.

In the above equation, y(n) is the new energy value, x(n) is the absolute value of the difference between the input signal from the microphone and the DC offset provided by the microphone circuit, and α is the time constant of the energy accumulator. The parameter α is chosen so that we attain a time constant of about 12 ms, the resulting choice of α was 0.01.
Once the user has uttered a letter and the energy passes the threshold, the PIC32 will collect the first 256 samples after the threshold crossing and the last 256 samples before the energy decays below the threshold.
FFT
Next, we want to analyze the frequency spectrum of the two sets of 256 samples to detect if a particular letter was uttered. So, we need to use the Discrete Fourier Transform or DFT of these sets of samples, which is commonly implemented by the Fast Fourier Transform or FFT. The below shows the formula for the DFT. So, we perform a 256 block FFT on both the first 256 samples and last 256 samples to obtain the spectrum. The length of the resulting vector Xk is also of length 256. However, for a real-valued input to the equation, Xk is symmetric between the first and last 128 entries, so we only inspect the first 128 elements.
In the end of the FFT process, we have two vectors of size 128 corresponding to the spectrum of the first and last 256 samples. With a sample rate of 8 kHz, the maximum frequency component that can be analyzed from the FFT arrays is 4 kHz. With 128 entries in the array, the frequency resolution is about 31 Hz per array element.
Mel Transform
At first, we thought to extract the peaks from the spectrum of the FFT. However, it turned out that this method was very ineffective because there was a large amount of variation of the magnitudes of the spectrum due to the variety of sources such as volume, gender, and other individual throat dynamics. Even when we had tried to normalize the spectrum, it was still very difficult to analyze the entire array. However, what remained constant was the relative peaks compared to the rest of the spectrum. Still, navigating through the entire 128 length array to detect peaks is very time-consuming.
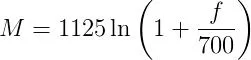
After discussing how to analyze the FFT with Bruce Land, he suggested applying a Mel filter bank to the spectrum. This first requires converting the frequencies to the mel scale, which is proportional to the natural log of the frequency. This conversion is appropriate because our ears perceive frequency (and sound intensity) on a logarithmic scale and thus allows the PIC32 to analyze the “perceived pitch” of the signal. The actual frequency to mel scale conversion that we used is provided by the below equation. There is a link in the References section for more information on the Mel scale.
The mel filterbank is a set of triangular filters that aim to focus on a small region of the spectrum in the mel scale. Since the mel scale is the logarithm of the actual frequency, a region of large values in the mel scale correspond to a larger region of even larger values in the frequency range. For our design we used a set of 10 filter banks to analyze the spectrum. We also normalized the each filter in the bank so that the area of each filter is equal to 1. The figure below shows a MATLAB plot of both the original filter bank and the Normalized filter bank.
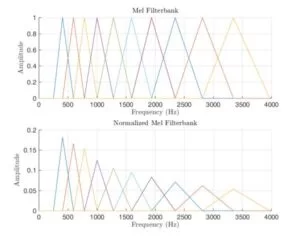
We apply the filter bank to the two FFT spectra and sum the energy in each filter to obtain two vectors of length 10, each entry containing information on the localized energy of the corresponding spectrum. For more details on the Mel Scale and the filter bank, refer to the link in the References section: “Mel Scale and Filter bank.”
Logical Structure
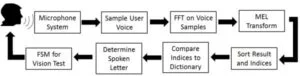
The overall structure of how our speech recognition eye test is implemented is shown in the below figure. Our lab starts by displaying a large letter. Then, the user speaks into the microphone system (microphone, filters and amplifiers). The output of the microphone system is inputted into the PIC32 and sampled at a rate of 8 kHz. The PIC32 stores the first and last 256 samples in two separate arrays. These arrays are then passed into an FFT to switch from the time-domain into the frequency domain. Then, a Mel transform is applied to the FFT results to average the frequencies into 10 bins. These bins are then sorted, along with their corresponding indices. The indices are then compared to the dictionary to see which letter in the dictionary most closely matches to the spoken letter. Once the spoken letter has been determined, it is inputted into the FSM used for our vision test. The FSM will then determine if it is ready to print the results to the TFT for the user to see or if it needs to display a new letter and repeat the process in order to get more information from the user.
Hardware/Software Tradeoffs
For our project, since it is very software heavy, the only hardware involved is the microphone circuit. This leads to us not needing to worry about hardware/software tradeoffs since we decided early on that most of our project would be implemented in software.
Standards
Our eye test works using the standard approach of determining how accurate someone’s vision is 20 ft away from the display compared to what the average person can see at 20 ft away. We refer to the Snellen eye chart to help determine the formula for a person’s eyesight as well as links for the Snellen eye chart listed in our Appendix.We also had to choose text sizes on the PIC32 that closely line up to the proper proportions for the Eye chart. There is a link in the Appendix to a website detailing the proportions between the various levels of visual acuity and the font sizes. However, we were not as stringent on the text size specifications since the TFT LCD screen was not large enough to display the sizes in the website. So, we had to scale down the font sizes, while still maintaining proportions, to fit the screen.
Using our project, a person could perform the Snellen eye test without the need to leave their house. The results could then be stored and even printed to a computer. If a doctor is familiar with the project, he could then use the data to conduct further eyesight testing instead of spending time needing to measure the person’s eyesight. Of course, the Snellen eye test should only serve as a guiding tool for one’s eye care and one should always consult with the eye doctor for further concerns.
Patents, Copyrights, and Trademarks
Our designed was based on existing accepted methods of speech recognition. Many mathematical operations such as FFT and Mel transform are used for the general process. Besides that, we did not find any patents and copyrighted or trademarked items relevant to our project.
Hardware/Program Design
Hardware Design
TFT Display
The TFT Display was used to display letters in different sizes for the eye test, and it was used to display the final result of test.
Microphone
The microphone was simply set up to capture sound input from tester. The captured voltage signal would pass through both a high-pass filter and a low-pass filter with cutoff frequencies of around 300Hz and 3400Hz, respectively. The signal is added by Vdd/2 and amplified with a gain of 1340 to make it range from 0 to 3.3V before inputting into the ADC of the PIC32.
PIC32
The PIC32 held most of the hardware for this project. It controlled the TFT Display and included the most important sub-component, the 10-bit ADC which converts the analog voltage input from the output of the op Amp to a digital signal.
Program Design
ISR
The ISR is setup to timer 2 and occurs with a frequency of 8 kHz. The ISR is used to sample the user’s voice while the user is speaking to create the samples used by the speech recognition portion of the lab. The ISR first reads in the value of the 10-bit ADC that took in the output of the microphone system. It stores the energy taken from ADC and then computes the new energy using the formulas described in the Energy Sum and Threshold section. If the energy is greater than a certain threshold, then it indicates that the microphone is picking up the user’s voice. The ISR will then record the first 256 samples of the user’s voice. After it has stored those 256 samples of the user’s voice, it will keep storing the most recently spoken 256 samples until the energy goes back to being below the energy threshold (user stopped speaking). This leads to two arrays with 256 samples each to be used by the speech recognition portion. Note that these samples are stored as fix16 numbers since it is more efficient to perform arithmetic on fix16 than on floats. We used Bruce’s macros on fix16 referenced in the Referenced Code Section. After the ISR has finished recording, it will enter a delay period of one second kept track of by a delay counter (“delay”). This is to make sure the ISR does not start recording any trailing utterances made the user. After the delay period is over, the ISR clears the necessary flags and repeats the above process.
FFT Function
void FFTfix(int fr[],int fi[], int m): This function performs the FFT on the array inputted into “fr”. Then, it stores the real components of the FFt in “fr” and the imaginary components of the FFT into “fi”. The “m” input is used to specify the block size of the FFT on a logarithmic scale. We used a 256-block FFT, meaning that “m” was 8 (log2256). This function is from Bruce’s spectrum analysis code found at and it works according to the equation in the FFT section of our site.
FFT Thread
The FFT thread is used to perform an FFT and a Mel transform on the two arrays, each with 256 samples, in that order. To perform the FFT, it simply calls the FFT function described above. Afterwards, we are left with two arrays, each with 256 samples in the frequency-domain. These samples are then grouped together according to the Mel transform described above. This leads to two arrays, each with 10 elements to it.
Merge Sort
void mergeSort(fix16 sorted[], int indices[], int len): The merge sort is from the the Sing Lock final project referenced in the Referenced Code Section. It takes in the array of elements you want to sort (“sort”), the indices (“indices”), corresponding to original locations of each peak, and the length of the arrays (“len”). After the function call, the sort array will be sorted and the indices array with have been sorted to match the sorted array.
Speech Thread
The speech array is used to determine which letter was uttered by the user. This array uses the feature vectors computed by the FFT thread to do so. It performs a merge sort on the arrays using the merge sort function described above. It then uses the indices sorted by the merge sort as the final features extracted of the user’s sampled voice. It compares these resulting feature vectors to the dictionary. The dictionary is a 2D array storing the expected sorted indices for each letter. It compares the feature vectors using the speech recognition algorithm defined in the Appendix. The feature vector in the standards 2D array that results in the smallest error is the the letter the user uttered, as guessed by the code.
FSM Thread
This thread implements the FSM, or finite state machine, shown in the Appendix. It starts by displaying a letter to the screen. Then, it waits for the user to utter a letter and the code to guess which letter was uttered. Once the user has guessed, it increments the guessed threshold. If the user guessed correctly, it increments the correct variable. If the user guessed enough correctly (indicated by the correct threshold) the text size gets smaller and the correct and guessed variables are reset to 0. However, if it was already at the smallest text size, it displays “20/20” as the results. If the user guessed more than the guessed threshold without guessing enough correct to move on, then the code determines the user’s results based on the current text size. The reason we require a certain correct or guessed thresholds to be met is because we want to make sure we have enough data from the user to display a proper result. We also, need to account for the fact that our speech recognition algorithm does not perfectly guess all the letters in our dictionary see Results section for details).
LCD Thread
This thread waits for the FSM to determine that it is ready to print the results to the TFT. Once the FSM signals it is ready, the LCD thread prints the results to the TFT.
Main Method
The main method is used to set up the ADC and timer for the interrupt, initialize variables, and set up and schedule the threads.
Connecting Threads Together Using Flags
The threads sets flags to indicate when the next thread can start running. This means that the other threads yield until their corresponding flags are set. This is to make sure the code works according to the flow chart shown in the beginning of the Logical Structure section. The code starts with the FSM displaying a letter. Once the ISR has determined that a user has started talking, it sets the record variable to 1 until the user stops talking. The FFT thread waits for the record variable to be set to 1 and then back to 0 (user started and then finished guessing the letter). Once the FFT thread has finished computing the FFT and Mel transform, it sets the calc flag to 1. The speech thread yields until calc is set to 1 and then determines what letter was guessed and sets calc back to 0. It also sets done_guessing to 1. The FSM yields until done_guessing is set. Once it is set, the FSM determines what state to move to and sets done_guessing back to 0. If the FSM has reached its final state (Display Results), it sets the results_rdy flag to 1. The LCD thread is set to print the results when results_rdy is set to 1.
Integration of Hardware and Software
A majority of our code was software based, which meant integrating the hardware and software together did not require much since there was very little hardware. We simply needed to connect the TFT to the PIC32 and the output of the microphone circuit to the ADC of the PIC32.
Other Attempted Designs
Over the course of working on our final project, we applied many different speech recognition algorithms to our training data in Matlab. We originally tried using only the peaks of the FFT. However, these peaks varied too much based on who was speaking and how loudly they were speaking, even when we normalized the magnitudes by the largest one. However, the location of the peaks remained constant. This led to us using the indices of the sorted array as opposed to the actual values. Then, we decided to weight the distance each element was off linearly. However, we noticed that having two consecutive elements swapped (two off by one) was way more common than having one element being off by two when looking at a single letter being uttered. Therefore, we decided to weight the distance it was offed quadratically. We also, tried different standards using our training data and chose the one that gave the least error when simulated on our data in Matlab.
For our lab, we needed to set proper thresholds. For the energy threshold, we first printed the energy to the TFT. We then determined our threshold based on the energy printed when we spoke versus the energy of the noisy lab room when we did not speak into the microphone. After testing multiple thresholds out, we determined that a threshold of 85 properly filtered out the noise while still picking up the user input. We also just played around with the guessed and correct threshold. We decided having a correct threshold less than three dd not provide enough information since the user could just guess correctly and move on or because our speech recognition algorithm could get one wrong and that would throw off the FSM too much. After setting the correct threshold, we tried out different guessed thresholds (obviously larger than the correct threshold or the user would never be able to move on to smaller text sizes). We settled upon a guessed threshold of five since it was the lowest value we could set it to and still have our overall vision test be accurate. We wanted to keep it as low as possible since if the threshold was to high the user could remain stuck at a state too long since that could annoy the user.
Results
Filter and Amplification
Microphone and circuit output can be found under Appendix D.
Time and Space Efficiency
For our lab, being time-efficient was not a main concern. This is because the code needed to wait on user input. This meant that we could have our overall FFT yield for 30ms without the user realizing this delay since it takes at least 2 seconds for the user to determine what letter was said and finish speaking it into the microphone. This led to us setting an our yield times to have the overall computations and delays to equal one second to avoid picking up any trailing sounds made the user made shortly after they were already done speaking.
Also, for our lab, being memory-efficient was not a major concern since our dictionary was only composed of 5 letters and 2 10-element fix16 feature vectors per letter. Therefore, we could store our dictionary into a 2D without needing to worry extra storage.
Accuracies of Speech Recognition
The table below shows the accuracy of the speech recognition for each of us. We each uttered every letter ten times close to the microphone.
| User Name | A | E | I | R | L |
|---|---|---|---|---|---|
| Margot | 100% | 60% | 90% | 80% | 90% |
| Yuchen | 100% | 60% | 70% | 100% | 100% |
| Joel | 90% | 50% | 90% | 90% | 100% |
Accuracies of Vision Test
For our lab, the possible visions you can get are 20/20, 20/30, 20/40, 20/50, 20/100, 20/200. This means that our eye test cannot return any values other those (so 20/25 cannot be determined by our eye test, it would simply be seen as either a 20/30 or 20/20).
We guessed each letter correctly and compiled a table of what eyesight the eye test returned.
| User Name | 1 | 2 | 3 | 4 | 5 |
|---|---|---|---|---|---|
| Margot | 20/20 | 20/20 | 20/30 | 20/20 | 20/20 |
| Yuchen | 20/20 | 20/20 | 20/40 | 20/50 | 20/20 |
| Joel | 20/20 | 20/20 | 20/40 | 20/20 | 20/20 |
Conclusion
Evaluation
Although our letter detection was not perfect in every aspect, the operation of the project works as expected. It was able to recognize the letters we spoke into the microphone circuit with great accuracy and allows accurate estimations of the user’s visual acuity.
However, there is still room for improvement. For example, we have only used two sets of Mel Transformed feature vectors as a basis for letter recognition. However, we could increase the accuracy by taking more samples to calculate rather than just the first and last 256 samples. In addition to that improvement, we could also have increased the number of filters, and consequently increased the length of the Mel feature vector for our Mel Filter bank. This would lead to us having more features for each letter in our database, which would increase the accuracy of our speech recognition portion since there would be more to compare the sampled user’s voice to.
Also, we could have extended the dictionary to feature more than just five letters. However, we would need to modify our speech recognition algorithm to do so since for our current speech recognition algorithm we only extracted information from two sets of 256 samples. We first had 7 letters: A, E, I, O, U, R, and L. However, U and O were not behaving very well due to their phonetic properties that make it difficult for the speech recognition algorithm to detect them at its current state. So we ended up having to scrap those letters in our final project. By having more features as described in the previous paragraph, this could allow the PIC32 with our algorithm to expand its capability to detect more letters.
If we had more time and the additional resources, we could evolve our project to have radio capabilities where the project could consist of two modules, one with the TFT LCD display and PIC32 and the other with the microphone module. These modules could then be separated and moved around easily since there would be no wires between them. With no wires, the project could also expand to include measuring the distance between the LCD and the microphone to signal the user where he or she should stand before beginning the test. Also, with a larger LCD screen, we could provide a more accurate choice of text size for displaying and then provide a more accurate result to display to the user.
Intellectual Property Considerations
All the hardware design was done without referencing projects or work from others. Some of the software, however, did come from different authors. We credit Professor Bruce Land with the FFT algorithm code which he had adapted from code by Tom Roberts and Malcolm Slaney. We also credit Professor Bruce Land with the 16:16 Fixed-point notation macros to implement fixed point arithmetic. The MergeSort function came from the group who created “SingLock” as their final project last year. The members consist of Sang Min Han and Alvin Wijaya. We also thank the “Singlock” group for their project inspired us to form this project. The code for the Finite State Machine we borrowed from our Lab 2 code, which was used for a DTMF Dialer we constructed in this class. For operating the TFT LCD display, we also used code borrowed from Syed Tahmid Mahbub, whose blog we have referenced.
We borrowed no code from the public domain.
We have not signed any non-disclosure forms for any reason.
Though we may not have searched very thoroughly, by Professor Bruce Land’s recommendation, we believe that there are patent opportunities for our project.
Ethical Considerations
Throughout implementing our project we made sure to stay in accordance with the IEEE Code of Ethics. Our project does not discriminate against any persons based on race, religion, gender, or disability. Our project cannot be used by the speech-impaired, but this is simply due to the nature of our project as something containing a speech recognition portion.
As we were developing the ideas for our project, and specifically for the Speech Recognition portion, we always sought, accepted, and offered honest criticism. Professor Bruce Land helped us a lot with how we should analyze the voice samples in a way that neither made the PIC32 use too much resources nor did our analysis use very little. We also recognize the limitations of the project as well as various ways to improve it as mentioned in the “Evaluation” section above.
We claim nothing of the code that we did not make ourselves and we also cited the sources for any code that served to help bring our project to fruition. For example, we credited the “SingLock” group, Sang Min Han and Alvin Wijaya, for their MergeSort function that was necessary for our letter recognition and we also credited Bruce Land with the FFT code.
Legal Considerations
As far as we know, there are no legal considerations involved with our project since all the code we used was either written ourselves or is properly cited in our report. We also properly cite in where our formulas for the FFT, Mel transform and any other mathematical formulas came from.
Source: Speech Recognition Eye Test
- What letters are in the dictionary used by the eye test?
The dictionary contains the letters A, E, I, R, and L. - How does the system detect that the user has started speaking?
It uses an energy accumulator with a time constant (α = 0.01) and a threshold (set to 85) to detect speech onset. - What sampling rate is used for capturing audio?
The system samples at 8 kHz. - How many samples are stored for analysis when a letter is spoken?
The PIC32 stores the first 256 samples after threshold crossing and the last 256 samples before energy decays below threshold. - What signal processing steps are applied to the recorded samples?
They perform a 256-point FFT on each 256-sample block, apply a 10-filter Mel filterbank, and use sorted feature indices for classification. - How is the next letter size determined during the eye test?
A finite state machine tracks guessed and correct counts and reduces text size when the correct threshold is reached; excessive incorrect guesses produce a result at the current size. - What visual acuity results can the test return?
Possible results are 20/20, 20/30, 20/40, 20/50, 20/100, and 20/200. - How is the microphone signal prepared before ADC input?
It is band-pass filtered (≈324 Hz to ≈3058 Hz), DC-biased to Vdd/2 via a voltage divider, and amplified to span 0 to 3.3V with gain ≈1340. - What method is used to compare extracted features to known letters?
Sorted indices from the Mel feature vectors are compared against a 2D dictionary of standard feature indices; the dictionary entry with smallest error is chosen. - Why was the Mel filterbank used instead of raw FFT peaks?
Because peak magnitudes varied widely with speaker and volume, while relative peak locations (captured by Mel indices) were more consistent and efficient to analyze.