Summary of Spectrum Analyser
This article details an Audio Spectrum Analyzer built on a PIC32 microcontroller, featuring real-time speech acquisition, Mel-frequency spectrum visualization on a TFT screen, and PC plotting via MATLAB. The system captures audio, applies FFT and Mel filter banks, and supports recording/playback using serial RAM. It also includes a UART interface for data transmission and handles user inputs through switches and LEDs to toggle between spectrum and spectrograph modes.
Parts used in the Audio Spectrum Analyzer:
- PIC32mx250f128b Microcontroller
- Electret Microphone
- MCP6242 OPAMP
- 2.2" 18-bit color TFT LCD display (Adafruit)
- 23LC1024 Serial RAM (1 Mbit)
- MCP4822 12-Bit DAC
- USB to TTL Serial Cable (Adafruit)
- Mode Selection Switch
- RECORD Button
- PLAY Button
- 1 kHz Low Pass Filter
- 10K Resistors
- 330 Ohm Resistors
Introduction
The webpage describes the development of an Audio Spectrum Analyzer based on PIC32 microcontroller with the following features:
- Real time speech signal acquisition
- Spectrum and spectrograph visualization of Mel Frequency bands
- Serial interface for forwarding Mel Frequency Band Power Spectrum coefficients
- Recording and playback of speech signal using serial RAM
- Spectrum Visualization on PC using MATLAB serial interface
The system uses a microphone to pick up speech signal. The analog audio signal is sampled using ADC of PIC32 microcontroller. The signals are then converted into short windows and Fourier Transform is applied to convert from time domain to frequency domain. The FFT is then converted to Power Spectrum, followed by application of MEL filter bank. The MEL Power coefficients are plotted on the TFT screen as Spectrum or Spectrograph depending on display mode. They are also forwarded to external PC using UART interface where a MATLAB program also plots the Spectrum. In addition to the Analyze mode, Record and Playback modes are available, which records a sound signal of 5 seconds duration and does playback respectively.
High Level Design
Who doesn’t like to have a personal assistant to do things for you and answer your queries? The growing popularity of Alexa, Sir, Cortana, Google Assistant and all others are testaments to this booming trend. Speech recognition is the ability of a machine to understand spoken words and sentences. The motivation for this project is to implement a front end for Speech Recognition engines.
Speech Recognition is a highly complex process, which is not possible to fully complete within the allotted 5-week period. Also, the complex computation involved in this may be too intricate to implement using a single PIC32 microcontroller. However, the analog interface and real-time nature of PIC32 microcontroller makes it suitable for real-time acquisition of the audio signal which is the first major stage in Speech recognition. Moreover, the serial interface can be used to connect the front end to further stages for processing.
Audio input
The audio signal is received through a microphone and DC shifted using a bias voltage, amplified and fed to the ADC of PIC32 microcontroller.
Analog to Digital Conversion
The continuous time continuous amplitude analog signal is converted to discrete time discrete amplitude digital signal using the internal ADC of PIC32 microcontroller. The closeness of digital value to the actual analog signal is determined by 2 factors. First, is bit depth and second is the sampling frequency. The ADC converts the signal to 10 bit values. The sampling rate is set to 16 Khz. he Nyquist-Shannon sampling theorem states that in order to accurately reconstruct a signal of a specified bandwidth the sampling frequency must be greater than twice the highest frequency of the signal being sampled. This theoretically gives a range of 0 to 8 Khz with sampling frequency 16 Khz. However, for speech signal processing 4 Khz is sufficient.
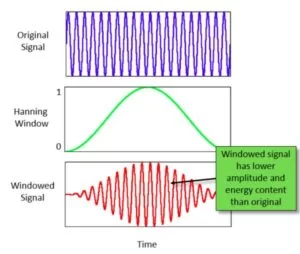
Hanning Window
The analysis of a signal can be performed by taking a finite set of samples at a time. But, when continuous signal is broken down into sets, it results in discontinuities at the ends. If analysis is carried out directly, these discontinuities would appear as spurious high frequency signals. To avoid this the amplitude of the discontinuities at ends are reduced by multiplying by a sequence. This sequence is called window function. One such window is a hanning window, which has a sinusoidal shape and touches zero at both ends.
It is given by:
Fast Fourier Transform
The Fourier transform is a mathematical algorithm that converts a time domain signal into its frequency representation. The DFT is obtained by decomposing a sequence of values into components of different frequencies. This operation is useful in many fields but computing it directly from the definition is often too slow to be practical. An FFT rapidly computes such transformations by factorizing the DFT matrix into a product of sparse (mostly zero) factors. The difference in speed can be enormous, especially for long data sets where N may be in the thousands or millions. In the presence of round-off error, many FFT algorithms are also much more accurate than evaluating the DFT definition directly. Using Discrete FFT, 256 samples of the audio signal are converted to 256 discrete frequency points. A fixed-point number based decimation-in-time FFT algorithm adapted from Bruce Land is used to convert the discrete digital audio signal into discrete frequency domain.
Power Spectrum
The Power Spectrum gives the how much of the signal is at a particular frequency. A PSD is computed by multiplying each frequency bin in an FFT by its complex conjugate which results in the real only spectrum of amplitude square.
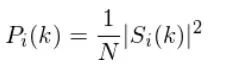
The amplitude spectrum can be obtained by taking square root of this value. However, direct computation of square root is not efficient in the PIC32 architecture. Hence, fast square root approximation technique is used.
MEL Filter
The human ear cannot differentiate between two closely spaced frequencies. This effect is increase as the frequency increases. Mel Filter banks are used to bin together the frequencies in a non linear manner. Then bins are narrower at lower frequencies and wider at high frequencies. This helps to visualize sound as perceived by the human ear.
The formula for converting from frequency to Mel scale is:
![]()
For speech signal the range of frequencies to be represented is chosen from 300 Hz to 4000 Hz.
Converting this to MEL scale we get 402 – 2146 as MEL frequency range To obtain 20 bins, the MEL range is divide into 21 linear values. This gives the MEL frequency bins between the following points.
402 , 485 , 568 , 651 , 734 , 817 , 900 , 983 , 1066 , 1149 , 1232 , 1316 , 1399 , 1482 , 1565 , 1648 , 1731 , 1814 , 1897 , 1980 , 2063 , 2146
To go from Mels back to frequency:
![]()
This gives frequencies at: 300 , 376 , 459 , 547 , 643 , 746 , 856 , 975 , 1103 , 1241 , 1390 , 1549 , 1721 , 1907 , 2106 , 2320 , 2551 , 2800 , 3068 , 3356 , 3666 , 4000
The frequencies in FFT number is obtained by multiplying with Number of samples (256) and diving by sample rate (16Khz). This gives:
19 , 24 , 29 , 35 , 41 , 47 , 54 , 62 , 70 , 79 , 89 , 99 , 110 , 122 , 135 , 148 , 163 , 179 , 196 , 215 , 235 , 256
The first filterbank will start at the first point, reach its peak at the second point, then return to zero at the 3rd point. The second filterbank will start at the 2nd point, reach its max at the 3rd, then be zero at the 4th etc. A formula for calculating these is as follows:
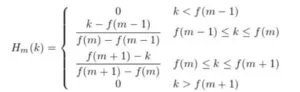
where ‘M’ is the number of filters we want, and f() is the list of M+2 Mel-spaced frequencies.
The project is highly software intensive. Not much hardware/ software tradeoffs were involved in this. However, being computation intensive, code optimization is very important. Algorithm selection was carried out by considering the hardware limitations in the microcontroller. In the above description, two such algorithms are used for efficient computation.
1. Fast Fourier Transform
2. Integer Square Root approximation
Hardware Design
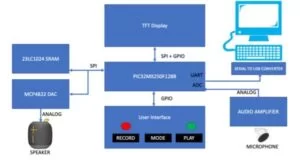
PIC32 Microcontroller
PIC32mx250f128b is the core hardware used in this project. It runs at 40 MHz clock frequency. The following peripherals of PIC are used in the project.
- 2 SPI Channels
- 1 UART Channel
- 1 ADC
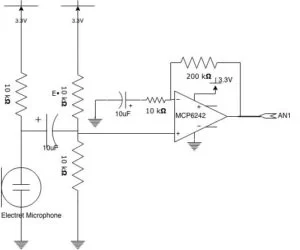
Audio Signal Interface
The audio signal interface circuitry comprises of a microphone, DC bias circuitry and audio signal amplifier. An Electret microphone is used to pick up audio signals. Electret microphones are very common in personal electronics due to their small size, excellent frequency response, and reasonable cost. A DC bias is added to the signal to make the voltage level above 0V. The output of the microphone is in the range of 100 mV. The signal is amplified using a MCP6242 OPAMP to 3.3V level and fed to channel AN1 of PIC32.
Display Interface
2.2″ 18-bit color TFT LCD display from Adafruit is used in the project. It is controlled by the PIC through SPI channel. It is part of the Big Board and the following interface is used between PIC and the Display.
TFT uses pins 4,5,6, 22 and 25 (RB0, RB1, RB2, MOSI1, SCLK1)
SCK: connected to RB14 on the PIC
MOSI: connected to RB11 on the PIC
CS: connected to RB1 on the PIC
RST: connected to RB2 on the PIC
D/C: connected to RB0 on the PIC
RAM and DAC Interface
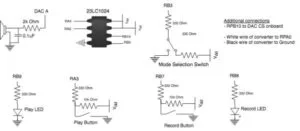
1 Mbit serial RAM, organized as 128K of 8-bit words (23LC1024) is used for storing recorded audio signal and MCP4822 12-Bit Dual Voltage Output Digital-to- Analog Converter with Internal VREF is used to playback the analog signal to the speaker. Both are interfaced to the PIC using same SPI channel. Different Chip Select signals are used to select between the two devices.
The signals between PIC and SRAM are shown below:
SCK: connected to SCK2 on the PIC
SI: connected to RPB5 on the PIC
SO: connected to RPA2 on the PIC
CS: connected to RPB4 on the PIC
The signals between PIC and DAC are shown below:
SCK: connected to SCK2 on the PIC
SDI: connected to RPB5 on the PIC
CS!: connected to RPB10 on the PIC.
The output of the DAC is connected to a speaker through 1 kHz low pass filter.
UART interface
USB to TTL Serial Cable from Adafruit is used to interface the PIC microcontroller with PC for serial communication. The white wire of the cable is connected to pin RPA0 (U1TX) of PIC
User Interface
The user interface comprises of the following switches and LEDs
Mode Selection Switch: Connected to RPB3 of PIC32
RECORD button: Connected to RPB7 of PIC32
RECORD LED: Connected to RPB8 of PIC32
PLAY button: Connected to RPA3 of PIC32
PLAY LED: Connected to RPB9 of PIC32
One end of all the switches are connected to the ground and other end is pulled up using 10K resistor. The LEDs and pulled up ends of switches are connected to PIC32 pins through 330 ohm resistors.
Design changes and optimizations
Initially, a microphone with built in amplifier was used in the design. However, as the module was designed for sound detection only, the output of the microphone was half wave rectified. This introduced harmonic distortion in the signals. Also, during playback, the audio was highly noise. The issue was resolved by using an independent microphone and designing the amplifier and biasing circuitry.
The initial pin assigned for Analog input was AN11. However, this was next to the SPI clock pin on the PCB. This resulted in injection of high frequency noise into analog input and caused spectral distortion. Attempts to filter the input did not have any effect as the noise injection was occurring on the PCB. The pin assignment was changed to AN1. The noise in the analog input and the output of the speaker was reduced but still present as the pin was adjacent to UART transmit pin. As no other pin was available, the same was used. The noise in the speaker was reduced by adding a 1 Khz low pass filter between DAC and speaker input.
Software Design
The software uses Protothreads. However, the entire program runs on a single thread. Instead of use threaded programming for pseudo parallelism, the software uses the inherent parallelism in PIC32 hardware for high performance.
The major components of the software are:
- ADC Interface
- Computation
- TFT Interface
- SRAM Interface
- DAC Interface
- UART Interface
- User Interface
- MATLAB code
ADC Interface
The 10 bit ADC in PIC32 is set to auto sample the signal from microphone. The sampling is driven by TIMER3. TIMER3 is configure to be triggered at the sampling frequency of 16 Khz. A DMA transfer is set up to copy the contents of the ADC register to a buffer. The DMA channel is configured to for a block size equal to the number of samples per window. After the initial setup, the entire signal acquisition sampling and framing is offloaded to the hardware.
Computation
Efficient methods for windowing, FFT, Power spectrum calculation and MEL Filtering are implemented in software as discussed in the previous section. The code optimization is carried out in this section so that the entire computation display takes place at a time which is less than the acquisition time. In this case, the acquisition time is Number of Sample/Sample Rate (256/16000) i.e 16 ms. Otherwise, realtime analysis cannot be carried out.
TFT Interface
The microcontroller communicates with the TFT over SPI. The library for TFT makes display of colors, blocks and lines fairly easy. The TFT is used to display both spectrum and spectrogram. The spectrum displays the distribution of frequencies for a given window and the spectrogram is a way of displaying multiple consecutive spectra over time. The x axis represents time, y axis represents MEL bands and the amplitude is represented by using color scheme varying from blue to red. In order achieve scrolling display for spectrogram, the technique used by Bruce Land in Filter bank log-centered spectrum analyser with TFT output was adopted. This erases a portion of the display and redraws the latest part of spectrogram. By avoiding, redrawing of the full spectrogram, a significant amount of time is saved. The Adafruit TFT color format is 16 bit: Top 5 bits encoding red intensity, mask is 0xf800, Middle 6 bits green, mask is 0x07e0 and Low 5 bits blue, mask is 0x001f. The color scheme for spectrogram is designed with a uniform division of hue scale to provide a sense of continuity in color for continuous variation in amplitude.
SRAM Interface
The SRAM used for storing the recorded sound is interfaced through SPI. 1 Mbit serial RAM, organized as 128K of 8-bit words (23LC1024) is used for this. Access is controlled by writing a read/write conmmand ORed with a 24 bit address to form 32-bit SPI data. The read/write command occupies the top 8-bits of the 32-bit word. Once a command/address is sent, sequential bytes can read/written using 8-bit transfers. For recording, the sampled buffer is send to the RAM from the program and read back during play back.
DAC Interface
Analog output is through a SPI controlled DAC. The SPI DAC that is used is the MCP4822. The SRAM data is ORed with DAC control word and sent to DAC through framed SPI transfer. The SPI is also triggered by TIMER3 so that sampling frequency for acquisition and playback are same.
UART Interface
The MEL spectrum amplitudes in each window is combined into a comma separated string and transmitted through UART. UART is configured with 8 bit mode with 19200 baud rate.
User Interface
Apart from the TFT, the other modes of user interface are done through switches and LEDs. The switch for selecting between spectrum and spectrograph is read before display of each window and in case of mode change the entire screen is erased and redrawn. Two buttons are provided for Record and Playback. These are processed in interrupts. Record and Playback states are indicated on screen using messages & progress bar along with onboard LED indications.
MATLAB code
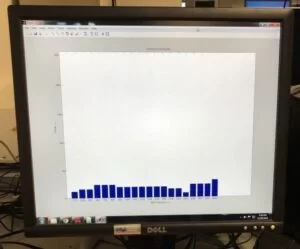
The MATLAB code receives data through UART at a baudrate of 19200. The integer values are extracted from comma separated string and plotted on screen as a bar graph, which gives a real-time display of the spectrum in addition to the TFT screen.
Design changes and optimizations
The initial computation where carried out with 512 sample per window and 8 Khz sample rate. However, this resulted in very high processing time. Processing time was brought to less than 16ms by changing to 256 samples per window and 16 Khz sample rate.
At first the ADC sampling was started after completion of computation to avoid data being overwritten in the buffer while it is being processed. But this was leading to delays and loss of samples between windows. To avoid this, DMA transfer was done to a temporary buffer in parallel with the processing, and later copied to the actual buffer just before processing of next window, using memcpy.
The TFT display for spectrograph was optimized by using VFastline function in TFT library instead of normal drawline function. The total duration of spectrogram display is limited by the pixel width of the display. Due to smaller size of display, it was difficult to capture patterns over longer durations. This was resolved by using a two-column display. Also, the color scheme was initially linearly mapped to amplitude. This was later changes to logarithmic mapping for better visual effects.
The SRAM interface was easy to interface for Byte Read and Write. Initially, Sequential Read/Write was not working. After referring the datasheet, the SRAM was changed to sequential mode by writing the 0x0140 control word the mode register.
Results
Overall, the project performed very well and all the core objectives were met.
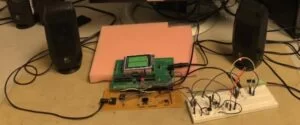
Hardware
The hardware was successfully wired, setup and tested. Most of the circuitry was done on solder board. However, some final improvements for noise reduction had to be carried out on breadboard.
Processing speed
The spectrogram responds to audio input with unnoticeable delay. The acquisition time for a set is 16ms with 256 sample at 16Khz sample rate. By parallelizing the acquisition of next window and processing of current window, maximum throughput was achieved. The processing time was measured as 11ms, which being less than the acquisition time would not lead to data loss.
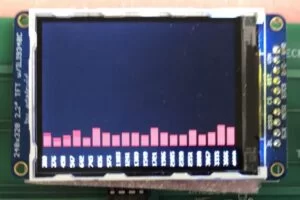
Spectrum Display on TFT
Spectrum display was achieved on TFT screen. The real-time variation in spectrum can be seen in the demonstration video. The frequency is displayed in 20 bins at following center frequencies:
376, 459, 547, 643, 746, 856, 975, 1103, 1241, 1390, 1549, 1721, 1907, 2106, 2320, 2551, 2800, 3068, 3356, 3666
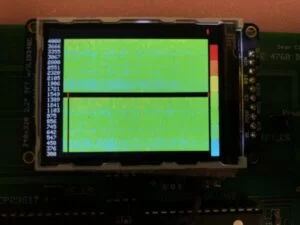
Spectrogram Display on TFT
3D visualization of audio signal was achieved on TFT screen, with frequency at y axis, time at x axis and intensity represented using color.
Spectrum Display on PC using MATLAB
Reception of serial data on PC and display of Spectrum using MATLAB was verified on PC. The spectrum observed on the PC and spectrum displayed on the TFT screen were compared and found to be identical.
Spectrograph of pitch variation in Speech signal
Rapid variations of pitch while speaking was captured on the spectrograph. The visual coherence of spectrograph display with the audible perception of sound was verified and found to be satisfactory.
Monotonic Sine Wave test
300 Hz sine wave signal was generated using frequency generator app on mobile phone. The frequency was ramped up to 4000Hz and then ramped down to 300 Hz. The variation in frequency display on both spectrum and spectrogram were simultaneously verified.
Voice Recording and Playback
Recording of voice and playback was verified. The output of the speaker was slightly noise but clearly audible. The same is visible in the demonstration video.
Safety
There were no major safety concerns in this project as we did not use any mechanical parts, high voltages, or wireless transmission in our device.
Interference
Interference of high speed digital signals with the analog input was observed in the system. The effect was minimized by keeping the analog pins as far from the high-speed signals as possible. However, it could not be completely eliminated. Since, the microphone input was not filtered, the system pickups up signals outside the range of 300Hz to 4000Hz also.
Usability
Several measures were taken to ensure that the system is user friendly. The frequency scales were displayed on the PC and TFT screen for both spectrum and spectrograph to for making the plots comprehensible. The color schemes for intensity mapping was also chosen to ensure readability. Apart from this, intensity color map was also displayed on the screen for coherence.
All switches were labeled on the solder boards to avoid confusions. The progress of recording and playback were displayed using LEDs and onscreen progress bars. Red color was chosen for both Record LED and Progress bar for consistency. Similarly, green color was chosen for both Play LED and Progress bar.
Conclusion
Our Thoughts
The project met all the goals that were set. In fact, additional display of Spectrum on PC using MATLAB was a secondary goal that evolved during the final stages of the project. This was also successfully implement.
Future Improvements
One area of improvement could be in the analog input stage. Currently, there is no filtering at the input stage. Addition of filters can restrict the input to 300Hz-4000Hz range, thereby avoiding spurious signals in spectrum. The major focus area for future work should be to use the serial data from PIC to implement speech recognition. This can be carried out in a PC or a microcontroller like RaspberryPi having much higher processing power than PIC32. User interface may be improved by providing the user with option to configure parameters like Number of sample per window and Sampling Rate. Currently, the user has to be very close to the microphone while speaking. This can be improved by making the input amplifiers gain tunable.
Conformance with Standards
There are no applicable standards for this project.
Intellectual Property
The mathematical background covered at the beginning is obtained from various sources available online, all of which have been cited in the reference section. the code to calculate the FFT was adopted from code provided by Bruce Land. This code was originally authored by Tom Roberts and improved by Malcolm Slaney. Multiple parts of code have been adopted from various programs written by Bruce Land and listed in Digital Signal Processing section of ECE4760 course website. Algorithm for fast computation of square root was obtained from codecodex website and the same is cited. No patent opportunities are foreseen.
Ethical and Legal Considerations
IEEE Code of Ethics was strictly adhered to. Safety was given high priority. All signal levels were at 3.3V level and did not pose danger to anybody. All prior work was acknowledged and cited. All data is represented accurately. There are no reasonable legal considerations for this project
Schematics and Circuits
Source: Spectrum Analyser
- What sampling rate is used for the ADC?
The sampling rate is set to 16 Khz. - How many samples are processed per window for the FFT?
The system uses 256 samples of the audio signal for the Fast Fourier Transform. - Can the device record and play back speech signals?
Yes, the system records sound signals of 5 seconds duration and performs playback. - Does the project support visualization on a PC?
Yes, a MATLAB program plots the Spectrum by receiving data via the UART interface. - What type of microphone is used in the design?
An Electret microphone is used to pick up audio signals. - How is noise reduced at the speaker output?
A 1 kHz low pass filter is added between the DAC and the speaker input. - What algorithm is used to convert time domain signals to frequency domain?
A fixed-point number based decimation-in-time FFT algorithm is used. - Why was the analog input pin changed from AN11 to AN1?
The pin was changed because AN11 was next to the SPI clock pin, causing high frequency noise injection. - What is the frequency range chosen for the speech signal processing?
The frequencies to be represented are chosen from 300 Hz to 4000 Hz. - How is the spectrogram displayed to save processing time?
The technique erases a portion of the display and redraws only the latest part of the spectrogram.