This Instructable is a beginners guide to debugging code programed in the MPLAB X IDE v2.0. The steps covered are common application’s of the debugger software and problems I encountered as a beginner user and a inexperienced programmer. The content will be useful to programmers with little experience using a microprocessor and writing code. More experienced users have a greater core of experience but also might find these steps a good review.

Step 1: Materials Required
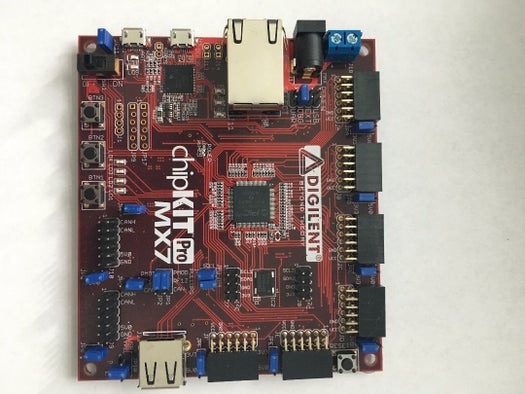
- chipKIT PRO MX7 by DIGILENT
- Personal Computer or Laptop
- USB Cable
- MPLAB X IDE v2.0 Software
- XC32 v1.31 Compiler Software
Step 2: Set Up the Board
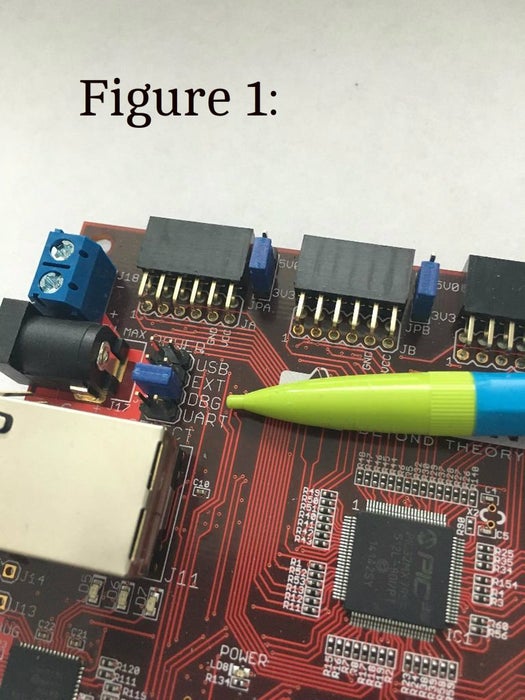
In order to use the licensed debugger with the compiler , the individual chipKIT microprocessor needs to be configured as follows.
- Select DBG with the jumper in J3. See figure 1.
- Connect USB cable to DEBUG USB Connector. See figure 2.
Step 3: Set Up MPLAB X
Once the hardware is set up the software needs to be configured.
- Click on the MPLAB X ICON
- Click on Create New Project. See figure 3
- Click on Microchip embedded , stand alone project. See figure 4
- Click NEXT
- Select 32 Bit MCUs (PIC 32) and PIC32MX795FS12L. See figure 5
- Click NEXT
- Select Cerebot SN:XXXXXXX. See figure 6
- This is automatically updated once the DIGILENT Board is connected to the computer.
- Select X32 as the compiler. See figure 7
- This instructable is based upon using these parameters. Different compilers could work.
Step 4: Licensed Debugger Not Found Error
These next steps contain common errors and troubleshooting techniques while using the Debugger.
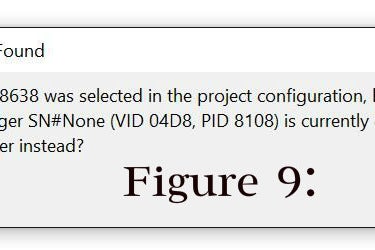
This step covers the problem that arises when the user opens a project they have worked on in a previous session after everything has been shut down and disconnected from the computer. Once the computer is turned on again and the DIGILENT Board reconnected the user tries to Debug their project.
- Click on Debug and Debug Main Project. See figure 8
- Click OK on Error Screen. See figure 9
- The program will try to connect to the DIGILENT board and connection will fail.
- Click RUN on drop down menu
- Select SET PROJECT CONFIGURATION
- Select Customize. See figure 10
- Select all parameters that were applied when the project was first created
- Select Apply. See figure 11
- Debug the project again.
Step 5: Compile Error
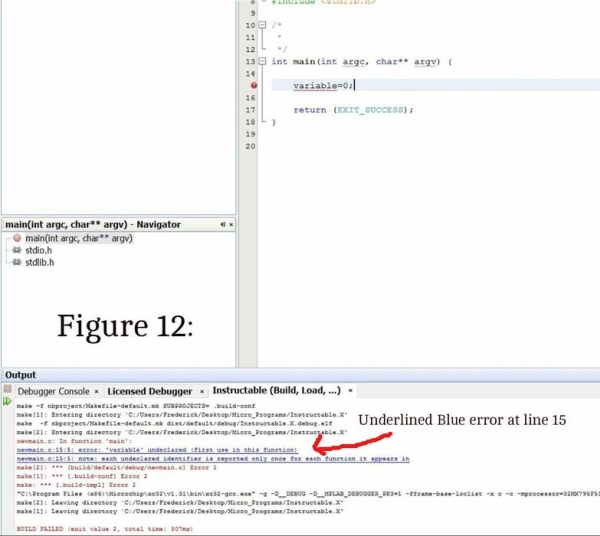
When Debug project build fails it is due to a compile error.
- Identify the blue underlined text in the output panel
- Identify the line number given to find the code causing the error. See figure 12
- Work through the list and fix all compile issues
- The user is expected to have some knowledge of the programming language they are using to solve these issues.
- Run the Debugger again and repeat for any new compile errors.
Step 6: Set Up Break Point
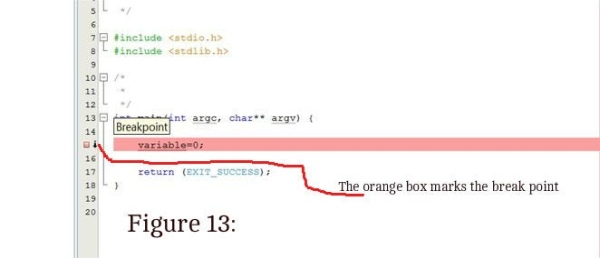
Break points are a valuable tool in the debugger program. They allow the user to pick a certain point in the code where the program will pause. Then the user can decide to move on in the code line by line to see if the code is working as intended.
- Identify the line in code that the user wants the compiler to pause at
- Place the cursor over the line number
- Click the line number
- Check that a orange box is now in place of the number. See figure 13
Step 7: Use Break Point
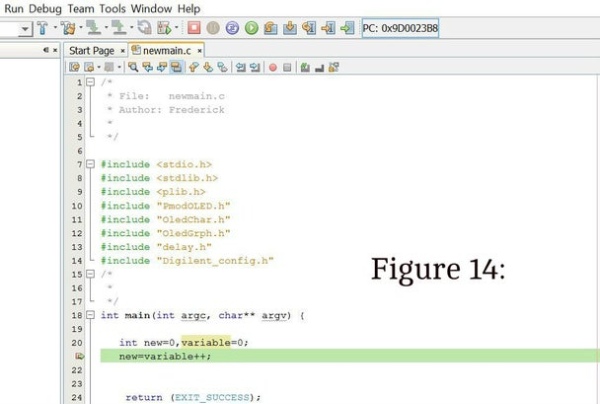
The break point is set up and now ready to use. Once the program pauses at the point the user can decide how to proceed. Options are line by line, move to a cursor placement, continue on through the code as normal. Using the break point process and the watch feature in tandem is a great tool to have in your debugging toolbox.
- Click Debug Main Project
- Notice the Green Box. This means the program has stopped here and entered the line of code or function. See figure 14.
- Decide what tools to use to continue on from the breakpoint. See figure 15
- Step Over: Executes one line of code or calls a function once.
- Step Into: Executes one source line or calls a function but stops at first line in function.
- Run to Cursor: Executes the program until the line where the cursor is placed.
- Continue: Resumes debugging program until next breakpoint.
- Click on the tool chosen
Step 8: Set Up Watch
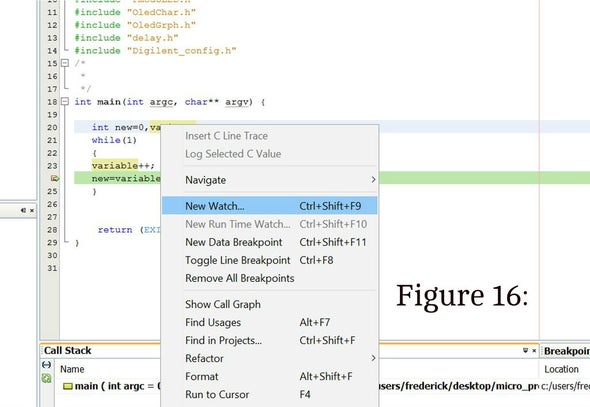
A watch is just as valuable as the break point. A watch will show the user the current address and value of any variable that the user wants to examine. This can help pinpoint if a variable is being updated or if that part of the code is being skipped over.
- Right Click on the variable in question.
- Select New Watch. See figure 16
- Click OK on the pop up window
- Verify the variable listed is the one the user wants to examine ( in figure 17 the variable is named variable)
Step 9: Use Watch
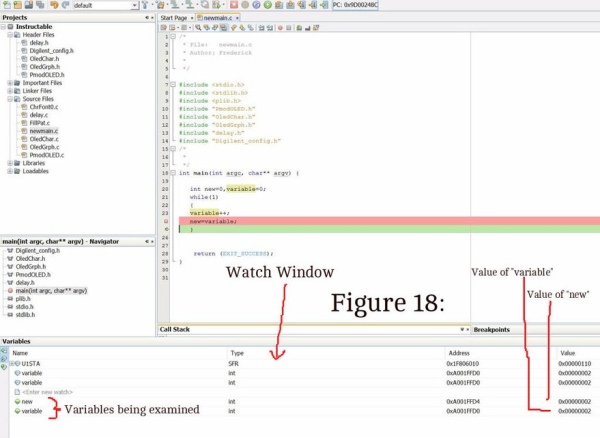
Using the Watch and break point in the example code used the user can use step into and watch the values of new and variable change and update.
- Create the watch for Variable and New
- Run Debug Main Project. See figure 18
- Figure 18 shows the main user interface when debugging with a watch and break point set. The values of the variables are “2” each because the screen shot is taken after clicking step into four times
- See figure 19 for initial conditions
- Click on Step Into
- Click On Step Into
- See figure 20
- Click on Step Into
- See figure 21
- The user can watch how the values of the variable(s) change. In the example code all the lines are working as intended. It would be easy to identify places where it was not using the watch and break point technique.
- Continue as necessary for any program
Step 10: Advanced Break Point Use
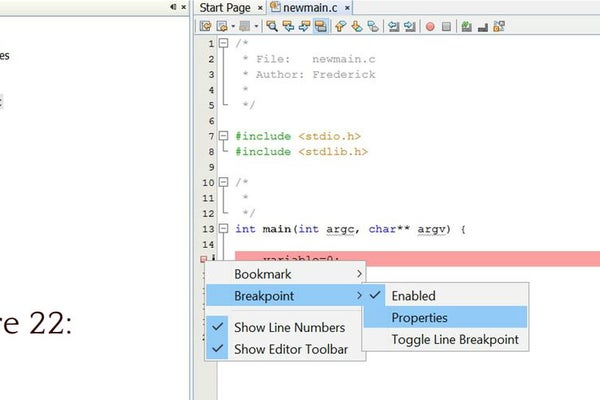
For code that uses for loop’s or some counting method to run analysis of a variable or array’s then the advanced options for a break point can be very helpful. It can allow the user to set how many times the program should cycle through the break point before pausing. This is very helpful in determining a specific index in an array.
- Right Click on the orange box where the break point is indicated
- Select break point and properties. See figure 22
- Choose to pause every time or after a user specified amount of times. See figure 23
- The user can decide how many iterations of the break point should be cycled. The default is every time.
- Run Debug Main Project
Step 11: Conclusion

With these common troubleshooting tools and solution’s to common errors the user will be able to create and troubleshoot any program! Remember to HAVE FUN! It is so easy a baby can do it!
Source: Beginners Guide to Debugging in MPLABX Using ChipKIT PRO MX7 by DIGILENT