Summary of BANANA SCAN
This project describes a "Banana Scanner" that uses spectroscopy to monitor fruit ripeness by measuring light reflectance at 678 nm. The system employs an XY plotter with stepper motors to move a spectral sensor over fruits placed on an acrylic sheet, mapping intensity data to a color-coded TFT display connected to a PIC32 microcontroller. A Raspberry Pi assists in controlling the motor movements via Python, while the PIC32 manages user input and sensor communication.
Parts used in the Banana Scanner:
- PIC32 Microcontroller
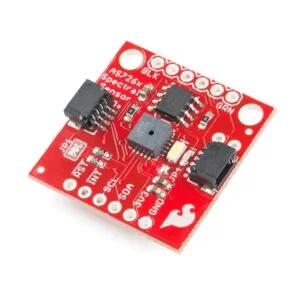
- Spectroscopy Sensor (SparkFun AS7263)
- XY Plotter (Salvaged from Phillips 239 lab)
- Stepper Motors (Nema 17)
- Adafruit DC & Stepper Motor HAT (PCA9685 Driver)
- Raspberry Pi
- TFT Display
- Clear Acrylic Sheet
- Potentiometer
- Push Button
- Blue and Pink Colored Paper Sheets
INTRODUCTION
Sometimes it is difficult to judge the ripeness of fruit visually, or we simply forget about our fruits until they are rotten. By using spectroscopy to monitor the change in the color of fruits, this device can track the ripeness of a variety of fruits including bananas and oranges. The system consists of a spectral sensor that measures the intensity of light waves at various wavelengths. The sensor is mounted on an XY plotter which moves the sensor underneath a clear piece of acrylic sheet. The fruits sitting on top of the sheet are scanned and the readings from the sensor are mapped to a color map on a TFT screen connected to a PIC32.
HIGH-LEVEL DESIGN
Here is an overview of the banana scanner.
The rationale behind this project is that as fruits ripen, their surface colors change due to a decrease in the concentration of chlorophyll-a based on the results cited by Li et. al. [1]. This suggests that color change in fruits could potentially be a good proxy for measuring fruit ripeness. Results from Li et. al. [1] indicate that reflectance of light waves at 678 nm has an inverse relationship with the concentration of chlorophyll-a levels.
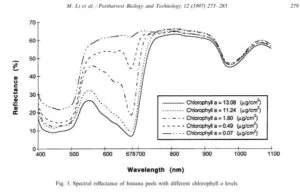
Light at 678 nm roughly corresponds to this color (678) [3], so it is not surprising that as the concentration of chlorophyll-a decreases, the reflectance of light at 678 nm increases (chlorophyll-a absorbs red lights). We sought to measure the intensity of the 678 nm light reflected off of fruits to determine their ripeness, so we obtained a reasonably priced NIR spectral sensor [2] that has a photodiode channel with peak responsivity at 680 nm and a full-width half maximum bandwidth of 20 nm. The sensor outputs its measurements in units of mircoWatts/cm2.
We needed a mechanism for the spectral sensor to move up-down and left-right in order to monitor ripeness along the shape of the fruits. For this, we used an XY plotter with two stepper motors – one for horizontal movement and another for vertical movement. To achieve an appropriate resolution for the color map, we programmed the stepper motors to move 1 cm per step since the sensor takes readings of microWatts/cm2. From a high level perspective, the movement of our scanner consisted of moving right in 1 cm steps along the scanning area, moving 1 cm. down, moving left along the scanning area, and then repeating until the sensor moved to the bottom of the scanning area. By this procedure, the sensor was able to create a color map corresponding to a 1 cm2 scanning resolution
The XY plotter was salvaged from the Phillips 239 lab and included the stepper motors, plotter strings/structure, and interface to control the motors. The stepper motors came with an Adafruit chipset which included the PCA9685 DC Motor & Stepper Driver and an I2C interface intended for the Raspberry Pi. Rather, than perusing and modifying the PCA9685 motor driver libraries for the PIC32 (which may be a half-semester of work), we decided to use the stepper motor chipset designed for the Raspberry Pi along with built in python libraries uploaded online for device users. We used a parallel bit communication protocol to send commands to the Raspberry Pi from the PIC32 to move the plotter as described in the software design section. The python program we wrote on the Raspberry Pi to control the motors and interface with the PIC32 is also described in the software design section. The stepper motors and a further explanation of the chipset we used is given in the hardware design section.
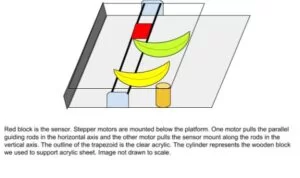
To get a consistent color map of each run, we needed to reset the spectral sensor to the same position at startup. We mounted two pieces of paper – one blue and one pink along the left side of the scanning area so that the plotter could find the startup position by using spectroscopy. At a later stage of this project, we realized that using limit switches at the reset position would have been a more optimal choice because our spectral sensor was near infrared (with wavelengths that did not necessarily correspond to the reset colors we used) and the limit switches would have allowed us to increase the scanning area. The acrylic panel was 30.48 cm x 30.48 cm, the colored papers used for reset were 5.08 cm. x 30.48 cm., and the scanning area was 25.40 cm. x 30.48 cm.
HARDWARE
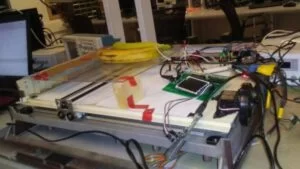
Below is an image of our full scanner.
STEPPER MOTORS
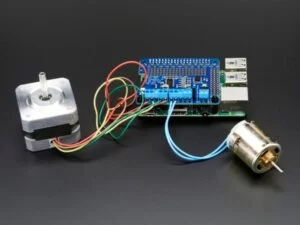
The stepper motors came from the salvaged plotter, and because we did not want risk breaking the plotter, we did not detach the motors from the plotter to determine their model numbers. We speculated that the motor is the Nema 17 from the Adafruit website since it looks similar to the ones we have and it is shown as a suggestion to the stepper motor driver shield that came with the plotter. The driver shield is Adafruit DC & Stepper Motor HAT for Raspberry Pi, which is why we chose to drive the motors with a RPi instead of purchasing another stepper motor driver for PIC32. We used the RPi library for driving stepper motors (listed in the datasheet and references section). How we determined the settings of the motors to achieve the 1 cm step size is explained in the software design section.
SPECTROMETER
We researched for an optimal spectrometer for our system given the following constraints and needs.
- A spectrometer that included a channel for reading waves of light that could monitor the level of chlorophyll-a in fruit (which has a peak absorption at 678 nm)
- A spectrometer that was at an ideal weight and size to fit on the top of an XY plotter
- Had either an I2C, SPI, or UART interface for communication to the PIC32
- A detailed datasheet and vendor instructions on usage
- Low Cost
From these qualifications, the SparkFun AS7263 was chosen for the system. Even though the sensor’s 680 nm spectral channel was 2 nm away from chlorophyll-a’s peak absorption, each channel had 20 nm of full-width half-max detection which includes 678 nm. The sensor proved to be of high-quality to this project due to its six spectral channels, high bandwidth detection, and integrated LED. The sensor additionally proved to be low-cost due to its weight, size, power consumption, and monetary cost. We would recommend this sensor to future spectroscopy projects for the above reasons.
SOFTWARE
Only one thread was used in our program: protothread_param which handled user input (deciding which fruit to detect), reset functionality, the scanning procedure to detect fruit ripeness, and the color map of ripeness on the TFT Display. Additionally we used a Raspberry Pi module to interface with the control of the stepper motors.
USER INTERFACE
We designed a user interface for the user to select a fruit to inspect for ripening. A potentiometer was hooked to an integrated ADC on the PIC32 to select the correct setting and button was used to load the selected setting. The options were laid out on the TFT screen and a white background highlighted the text that the user currently had selected. The three fruit currently on the interface are bananas, apples, and avocados. Although we had these options for the user to pick, we did not implement separate functionality for these fruits. A further improvement to this system would be to implement different thresholds for 680 nm intensity for different fruits by changing the mapping of the color map. For example, we observed that avocados have a much lower range of values for 680 nm intensity than bananas for instance. This is because the avocados stay at green color for most of the fruit ripening process. Please refer to the color map section for further discussion on such a future iteration of our system.
COMMUNICATION WITH THE SENSOR
We implemented a serial connection from the PIC32 to the spectral sensor with UART to communicate with the spectral sensor. The UART connection was necessary for switching the sensor’s integrated LED on/off as well as retrieving reflectance values from the sensor’s six near infrared channels. To send commands to the sensor, a thread was spawned with the macro PutSerialBuffer(struct pt *pt) which transmitted the contents of PT_send_buffer. To receive data from the sensor, a thread was spawned with the macro PT_GetMachineBuffer(struct pt *pt) which loaded received characters into PT_term_buffer until a specified termination character or time was reached. To establish the UART connection, the sensor’s Tx pin was hooked to the PIC32’s receive line for UART (specified to I/O pin RA1) and the sensor’s Rx pin was hooked to the PIC32’s transmit line for UART (specified to I/O pin RB10). The sensor Vdd pin had to be hooked to +3.3 volts as well as the GND pin to ground. We decided to hook the Vdd and GND pins to the Raspberry Pi’s +3.3 volts and ground because the sensor did not initialize properly with the PIC32 sometimes when powered by the PIC32. We speculate the cause of this issue was having the sensor’s uart line caught in error due to both devices having a race condition to send the first data bytes.
The UART command to acquire the 6-channel data from the sensor was “ATCDATA\r” with \r as the termination character. After a “\n” termination character was read from the sensor’s transmission, the intensity data from all six channels were were parsed into a six element array denoted as delimited[]. The c string function strtok() was utilized to parse the data into the six elements with a comma as the delimiter character between values.
COMMUNICATION WITH THE RPI
A parallel communication protocol was implemented between the PIC32 and the Raspberry Pi to get the plotter to move a set distance up, left, down, or right. Four bits were used in this protocol. Two command bits were used to specify a movement: up – 00, down – 01, left – 10, right – 11. A ready bit was set to ensure that the two command bits have been set correctly so that the Raspberry Pi did not read the command bits while they were being set by the PIC32. In addition, an acknowledgement was used when the plotter completed its movement. This acknowledgement bit was continuously read by the PIC32 after sending the command and ready bits to the Raspberry Pi by using the Pt_Yield_Until function. The PIC32 was aware of a completed movement once the acknowledgment bit was set high inside the Pt_Yield_Until condition.
RESET FUNCTIONALITY
As explained in the high level overview section, we mounted two colored sheets to the acrylic panel in order to get the spectral sensor to reset to the startup position properly. After the user specifies a fruit from the user interface, the thread begins the reset procedure with state 0 which inspects whether the sensor is located under the blue sheet, the pink sheet, or neither. If the sensor is not initially located underneath the blue sheet or the pink sheet, the sensor begins moving left until the blue sheet is detected (state 1). Once the sensor reaches the blue sheet, the sensor begins moving up the blue sheet until the pink sheet is detected (state 2). The pink sheet is located directly over the reset position, so once the sensor reaches this area it finishes the reset procedure by moving right until the scanning area has been reached (state 3).
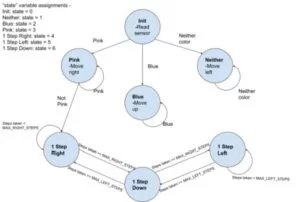
Before each movement, the PIC32 would read the 610 nm and 680 nm wavelength channels to determine where it was located. A combination of thresholds for the 610 nm and 680 nm received reflectance values were used. The explicit thresholds are discussed in the results section.
SCANNING PROCEDURE
Once the reset procedure as entailed above was completed, the program proceeded to the scanning phase. The scanning phase first consisted of stepping right a set number of times based on the length of the acrylic sheet and the distance the sensor traveled at each step (state 4). Then the sensor would move one step down (state 6) and move left the same amount of steps as it did moving right (state 5). Because of the scanning area located to the left of the acrylic scanning area, the scanning area had a bit more vertical distance to cover than horizontal distance to cover. In the end, the sensor moved 18 steps right/left and 20 step down to move through the entire scanning area. The program would keep track of the number of steps it moved right, left, and down in variables steps_right, steps_left, and total_steps_down respectively. Steps_right was incremented while moving right in state 4 and was cleared to 0 once the sensor made a down movement in state 6. Steps_left was incremented while moving left in state 5 and was cleared to 0 once the sensor made a down movement in state 6. Total_steps_down was not cleared to zero until the spectral sensor completed the scanning procedure.
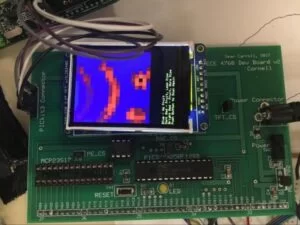
After the scanning procedure was complete, the program outputted the entirety of the color map along with a brief explanation of the colors and the ripeness levels they represented. The end display also prompts the user to to make another scan by pressing an external button. If this external button was pushed, the program would clear the TFT screen, reinitialize all the variables used in the program to their starting values, and display the starting user interface again.
TFT MAPPING
A color map was used to represent ripeness levels over the entire scanning area. The color map consisted of 12×12 pixel blocks with each block representing a 1 cm.2 portion of the scanning area. The tft_fillRect() with arguments for the top-left position of each block, the block width/height, and the block color was used to draw each block. The top-left position was altered according to the current state of scanning phase. For example, the x coordinate of the top-left position was incremented by 12 pixels each time the sensor moved a step to the right. The block width/height were set to 12 pixels.
The color of each block was determined by mapping the spectral intensity readings of the 680 nm wavelength channel into a color format encoding specified by the TFT display. The TFT uses an 11-bit color format with the top 5 bits encoding red intensity, the middle 6 bits encoding green intensity, and the low 5 bits encoding blue intensity. Since the color map used only blue and red (blue to specify that no fruit were detected and red to specify the detection of ripe fruit), the 0-512 intensity reading from channel 1 (680 nm) was converted into a range of 0-31 to encode the 5-bit settings for red and blue. The intensity reading was left shifted 5 bits and right shifted 9 bits to achieve this range conversion. The output of this calculation was then shifted left 11 bits to represent red intensity and was added to the blue intensity value. Since the blue intensity value represented the bottom 5 bits of the color format encoding, no additional shifting was performed on the blue intensity value. Nevertheless, the blue intensity had a maximum value of 13 to improve the appearance of the color map (no bright blue or bright purple colored blocks). The final equation to convert a 680 nm reflectance to a TFT color format is shown below:
color_reading = (reflectance_reading << 7) + (31 – (reflectance_reading >> 4) – 18)
We had opted for a continuous color mapping scheme instead of a discrete classification system (e.g. indicating that a fruit is very ripe, somewhat ripe, somewhat unripe, or unripe) because of the complexity of choosing the appropriate threshold values and developing an appropriate algorithm to implement on the TFT that would classify the fruits. Instead we allowed the users to interpret the color graph while informing them that the brighter red corresponds to a greater degree of ripeness.
RPI MOTOR CONTROL
For the RPi control program, we wrote a Python program that is started at boot. The python program first initialized the GPIO pins, GPIO input for the ready bit, the two control bits, and GPIO output for the acknowledgement bit. We used the four bits to communicate between PIC32 and the RPI as explained in the “Communication with the Raspberry Pi” section. The RPi continually polls the ready bit to see when the PIC32 is ready for the motors to move, and once the ready bit reads high, the RPi reads the command bits to see which stepper motor should move and in which direction. Then it spawns the thread to move the motor and wait for the thread to return. Once the motor thread exited, the program sets its acknowledgement bit high to let PIC32 know that the motor has completed a step and waits for the ready bit to go low (set by PIC32) before repeating the cycle again.
We set the motor rotational settings to 200 steps/rev, with a speed of 60 revolutions per minute and a double-step stepping style. We calibrated each motor to move one centimeter each time it was commanded to move: the horizontally moving motor needed 130 steps to move one centimeter and the vertically moving motor needed 210. Once one of the motors completes a horizontal or vertical step, the RPi transmits a high ACK bit to the PIC32 announcing its completion.
RESULTS
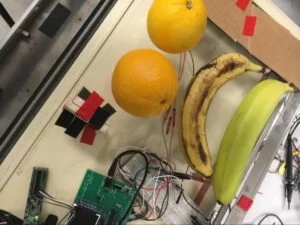
Our project satisfied our specifications for an adequate fruit ripening detector. The user could differentiate areas with unripe bananas and oranges from ripe bananas and oranges as seen in the image of the fruit and corresponding color map. Highlights of results include:
- The system could be reset an arbitrary number of times and the system is automated so the user is not forced to move the sensor manually during reset
- Accurate movement of the sensor by stepper motors. However, the system sacrificed speed for accuracy and scans took around 15 minutes to complete moving through the entire 25.40 cm. X 30.48 cm. scanning area with 1 cm. step movements
- The display did not have any visual artifacts and with no visual flashing or text out of place
- Uninterrupted scanning and the movement of the spectral sensor corresponded with the color map blocks drawn on the TFT display
One notable result is that our system worked less well with avocados, with color map readings of dark purple for both semi-ripe and unripe avocados. This is likely because avocados are of dark green tingent throughout their ripening process (until they become black when they have been ripe for a long time). Since chlorophyll-a and the skin of the avocado share similarities in their peak wavelength absorption, the range of intensity values for unripe and ripe avocados will be lower than the range of intensity values for unripe and ripe bananas/oranges. However, we could have adjusted the color map according to the fruit specified by the user to interpret a lower range of values for dark green fruit such as avocados. This was our original plan for the final design, as we coded the user interface for this very purpose. Under this design, only 1 fruit type could be scanned at a time unless additional thresholding was used to identify the fruit type before ripening.
During the demo, the first total scan of the fruits on the acrylic was successful, and the instructor could differentiate ripe bananas/oranges from unripe bananas/oranges. Nevertheless, the reset procedure of the system did not work as expected with the sensor not detecting the blue paper mounted on to the acrylic. We realized that the reset functionality of our system could be inconsistent during the later stages of the project because the intensity values of the 610 nm and 680 nm channels are more irregular for colors that do not have peak absorbance/peak intensity at those values (e.g. blue or pink). In addition, our sensor is meant for the near-infrared light spectrum, not the visible light spectrum, and in actuality only covers wavelengths of 610 nm or longer, which only consists of different shades of red in the visible spectrum. Therefore, a a more suitable mechanism for resetting the system would have been to use limit switches. The limit switch implementation would have offered a more consistent reset procedure by detecting when vertical or horizontal walls are hit by the sensor.
The threshold values of the blue sheet were:
- 610 nm: Between 1700 and 2300
- 680 nm: Between 180 and 320
The threshold values of the pink sheet were:
- 610 nm: Between 2400 and 3350
- 680 nm: Between 320 and 420
The threshold values were chosen through experimentation in different lighting areas. More specifically, we choose thresholds to be narrow enough so that the blue and pink thresholds did not interfere with each other and other fruit, and wide enough to try to capture the erratic nature of the intensity values for colors that did not have peak absorption/intensity at a 610/680 nm wavelength of light. However, because we did not normalize the values against the lighting conditions of the location we were testing in, the values varied whenever we changed locations.
CONCLUSION
SUMMARY
Our system performed as expected in that the sensor readings’ mapping to the TFT color matched our expectations. The bright red regions corresponded to regions with ripe fruits. For future works or what we wished we had done, we should have used limit switches as our resetting mechanism. Another improvement would be to take the ratio of the reading of 680 nm of a fruit and the reading of 680 nm with nothing on the acrylic to make the measurements more resilient to perturbations to the sensor caused by the environment. We had originally covered our fruits with a cardboard box for a more controlled lighting environment, but seeing that having a dark environment did not affect the measurements, we decided to leave out the box for our final design. In hindsight, this is probably because the lighting in the lab was not strong enough to produce a noticeable difference in the amount of current produced by the photodiode, but if we were to test our system under bright sunlight, the measurements would probably be severely affected. We should also have come up with a classification system to rate a fruit’s ripeness to formally calculate statistics of the accuracy of our system. We could also have calibrated our system to account for fruits that are naturally darker or greener (like avocados and plums). We believe the overall system is safe and works well for a person with neither mechanical skill or a knowledge of spectroscopy. The system is meant to be completely automatic other than pressing a single button/knob to specify fruit type or a reset. The color map is easily interpretable and the interface was designed to be as simple as possible. We also believe that our system could be of interest to grocers, viticulturists, and farmers, if we could further improve the system and collect tangible statistics on its accuracy.
CONFORMING TO STANDARDS
We found no applicable standards to which our design had to conform to.
INTELLECTUAL PROPERTY CONSIDERATIONS
While this project is derived from that of the research projects linked in references, we do not believe that our project infringes on any existing patents or copyrights. Our code structure was derived from the ECE4760 labs as cited in references; we used the standard PIC32 Peripheral library and the Protothreads library. The project utilizes common electronic components that have open-source guides which we used during development, and the system was built to suit our own unique specifications.
ETHICAL CONSIDERATIONS
For the duration of this project, we maintained our integrity and upheld the IEEE code of ethics. We designed our project with the safety of the user in mind, and strived to better our own knowledge and improve on existing technology. This project utilized many open-source resources, which have been listed in the appendix to properly give credit and reference for individuals who may wish to recreate this project in the future.
SAFETY CONSIDERATIONS
We do not believe our project poses much risk to the user. The biggest risk may be the brightness of the LED on the spectrosensor and the risk of eating unripe fruit from an improperly scanned piece of fruit. For the former, we suggest placing a box over the contraption to prevent the brightness of the LED from causing any lasting damage to the user’s eyes; for the latter, we offer our sincerest apologies.
LEGAL CONSIDERATIONS
As stated in the intellectual property considerations, we do not believe we have infringed on the intellectual property of any other individual or group. All resources utilized for this project has been properly cited and referenced in the references section.
Source: BANANA SCAN
- How does the scanner determine fruit ripeness?
The device measures the intensity of reflected light at 678 nm, which has an inverse relationship with chlorophyll-a concentration; higher reflectance indicates riper fruit. - Can the system scan multiple types of fruit?
Yes, the interface allows selection of bananas, apples, or avocados, though separate functionality for different thresholds was not fully implemented in this version. - What is the scanning resolution of the device?
The system moves the sensor in 1 cm steps to create a color map with a 1 cm squared scanning resolution. - Does the scanner use limit switches for resetting?
No, the current design uses blue and pink paper sheets to find the startup position, although the authors noted limit switches would be more optimal. - How long does a full scan take?
A complete scan of the 25.40 cm by 30.48 cm area takes approximately 15 minutes due to the trade-off between speed and accuracy. - Which microcontroller controls the user interface and sensor?
The PIC32 microcontroller handles user input, the reset procedure, the scanning logic, and communicates with the spectral sensor via UART. - How is the Raspberry Pi utilized in the project?
The Raspberry Pi runs a Python program to control the stepper motors based on parallel bit commands sent from the PIC32. - Why did the scanner perform poorly with avocados?
Avocados remain dark green throughout most of their ripening process, causing low intensity values similar to unripe fruit, which confuses the single-threshold color map.