Summary of PIC30F4011 OSCILLOSCOPE AND SPECTRUM ANALYZER 128×64 GLCD
This article details "Scopey II," a DIY oscilloscope and spectrum analyzer built to replace a damaged Tektronix 2213. Designed by Jaime Garnica, the device utilizes a dsPIC microcontroller and a 128×64 GLCD. The input stage features a resistive attenuator with selectable AC/DC coupling and amplifiers, including a programmable gain amplifier (PGA) for signal conditioning before analog-to-digital conversion. The spectrum analyzer function processes data using DSP libraries, applying windowing and FFT algorithms to visualize frequency domains on the display.
Parts used in the Scopey II:
- dsPIC30F4011 microcontroller
- 128x64 GLCD display
- Resistive attenuator with 1Mohm impedance
- AC/DC coupling switch capacitor
- Unity gain inverting buffer amplifier
- Level shifting circuit
- Microchip MCP6S21 PGA (programmable gain amplifier)
Scopey II: A Simple Scope and Spectrum Analyzer Facing the demise of my Tektronix 2213 in an somebody transport traveling, I featured the mind of either purchase an costly CRT to get it running again, or payment my nights… Electronics Projects, PIC30F4011 oscilloscope and spectrum analyzer 128×64 glcd “dspic projects, microchip projects, microcontroller projects,
Scopey II: A Simple Scope and Spectrum Analyzer Facing the demise of my Tektronix 2213 in an somebody transport traveling, I featured the mind of either purchase an costly CRT to get it running again, or payment my nights aquatics ebay for other ambit. Having two not so uppercase options, and having conscionable mark with copious amounts of withdraw experience, I definite to upright sort my own. Patch it power not feature the unvaried bandwidth or accuracy of the old Tektronix, it is a accessible lowercase device that I’m trusty will be quite efficacious once I block tinkering with it, and it has several nifty features that a nimiety
THE OSCILLOSCOPE:
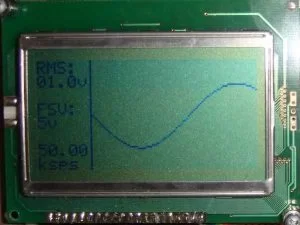
The oscilloscope consists of an input stage consisting of a resistive attenuator with 1Mohm impedance, a switch to remove or insert a capacitor for AC or DC coupling, followed by several amplifiers. The first amplifier is a unity gain inverting buffer, followed by a level shifting circuit to center the signal around .5Vcc (2.5V) for the PGA and ADC.
The stage immediately preceding the ADC pin on the dsPIC is a Microchip MCP6S21 PGA (programmable gain amplifier), which is used with gains of 1, 2, 4, 8, 16 and 32 to give gains (attenuation * gain) of 1/8, ¼, ½, 1, 2, and 4, allowing for a wide range of input signals to be visualized. The PGA is connected directly to an ADC pin on the dsPIC.
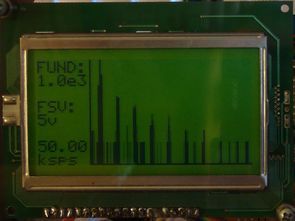
The Spectrum Analyzer uses the same input amplifiers as the oscilloscope, although the data format is signed fractional instead of unsigned integer in order to utilize the Microchip DSP libraries. Once acquired, the data is windowed using a Hann window and scaled to prevent overflow in the FFT functions. The data is then transformed to the frequency domain, scaled logarithmically, then displayed. When scaling the data, the bin containing the fundamental is found and the associated frequency is found and displayed in the text portion of the display. Author: Jaime Garnica
FILE DOWNLOAD LINK LIST (in TXT format): LINKS-10483.zip
Source: PIC30F4011 OSCILLOSCOPE AND SPECTRUM ANALYZER 128×64 GLCD
- Why did the author build this project?
The author built it because their Tektronix 2213 was damaged during travel, and repairing it or buying a replacement was too expensive. - What is the input impedance of the oscilloscope?
The input stage consists of a resistive attenuator with a 1Mohm impedance. - How does the device handle AC and DC signals?
A switch is used to remove or insert a capacitor for AC or DC coupling. - What specific Microchip component acts as the programmable gain amplifier?
The project uses the Microchip MCP6S21 PGA connected directly to an ADC pin on the dsPIC. - What range of gains does the PGA provide?
The PGA provides gains of 1, 2, 4, 8, 16, and 32 to achieve overall attenuation and gain factors ranging from 1/8 to 4. - How is the data prepared for the FFT functions in the spectrum analyzer?
The acquired data is windowed using a Hann window and scaled to prevent overflow in the FFT functions. - What format is the data in for the spectrum analyzer compared to the oscilloscope?
The spectrum analyzer uses signed fractional data format instead of unsigned integer to utilize Microchip DSP libraries. - What happens after the data is transformed to the frequency domain?
The data is scaled logarithmically, displayed, and the bin containing the fundamental is found to show the associated frequency.