Summary of MEASURING HEART RATE USING A PHOTOPLETHYSMOGRAPHIC CARDIOTACHOMETER
This article details the design of a photoplethysmograph system to measure heart rate using light variation through a finger. The device uses a red LED and a Cadmium Sulfide cell to detect blood flow changes, transducing resistance into voltage. The signal is amplified using an operational amplifier with a virtual ground to fit an A/D converter range, filtered to remove noise, and processed by a PIC microcontroller to display results on an LED ladder or calculate beats per minute.
Parts used in the Photoplethysmograph Heart Rate Monitor:
- Red LED
- Cadmium Sulfide (CdS) cell
- 47 kOhm resistor
- TLCV2772 rail-to-rail operational amplifier
- TLE2426 rail-splitter
- PIC microcontroller
- 10-LED ladder display
- Oscilloscope
- A/D converter
ABSTRACT
The heart rate is an important measure of health and physical fitness. Medical professionals rely heavily on the rate as a measure of health status and use it to prescribe treatment to individuals. Athletes value the heart rate highly as a tool for regulating frequency and intensity of workouts because the rate provides a quantification of exercise intensity. By looking at the rate, athletes can tailor their workouts to a heart rate target and receive quick feedback. Instant feedback is highly desired for these individuals, and fortunately simple devices can provide that to them.
A plethysmograph is a device that measures the amount of blood in a particular part of the body. A photoplethysmograph performs the task optically by measuring the variation of the amount of light passing through a part of the body�in our case, a finger�caused by the pulsatile nature of blood flow. This measurement allowed us to determine the heart rate by looking at the period of the blood flow.
DESIGN PROCESS
A simple block diagram of the photoplethysmograph system we designed is shown below courtesy of Erik Cheever.
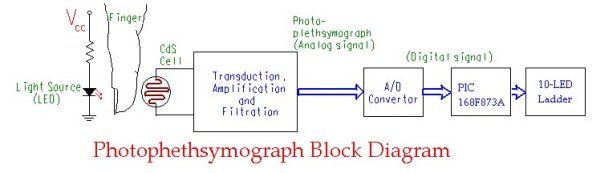
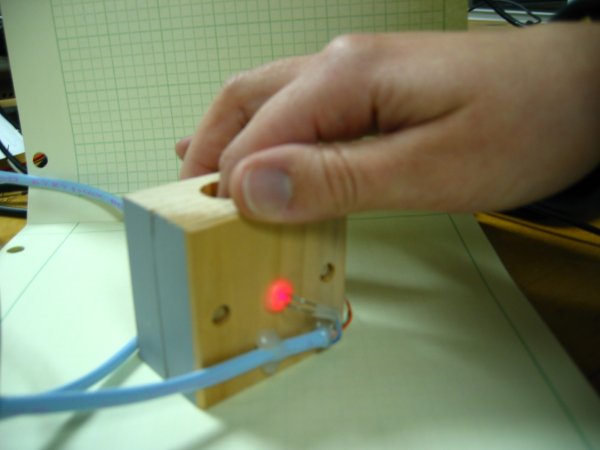
The finger is placed into a box with a red LED on one side and a Cadmium Sulfide (CdS) cell on the other side. The resistance of the CdS cell varies with the intensity of the light hitting it, and this intensity depends on the amount of blood in the finger. The change in the resistance is transduced into a change in voltage, and in its raw form gives a voltage range of 0 to 2.5 volts. We want to measure the variation in this
signal caused by the pulsatility of blood flow in the finger. By carefully examining the raw signal on an oscilloscope, we found that this variation is at most 10mV. This signal must be amplified into a 0-5 V range to take advantage of the full range of the A/D converter. The raw signal also
includes a great deal of noise which must be filtered out. After being converted to digital, the signal is analyzed using the PIC microcontroller, and the output is displayed on a 10-LED ladder. In one mode, the LEDs are set up to all light up when the CdS detects little light from having most of it blocked by the blood flow, and all turn off when encountering much light, corresponding to no fluid. In the second mode, the heart rate in beats per minute (bpm) is calculated from the period of the signal and different LEDs are lighted to indicate the bpm range in which the heart rate falls.
In this section, we have provided an overview of our project. In the following sections, we discuss our design process in greater depth and present our results.
Transduction, Amplification, and Filtration
Single supply design (Vcc = 5V) was required to power the circuit components.
TRANDUCTION
The CdS cell changes resistance in response to the amount of light it receives. To work with this signal requires that it be transduced into a voltage. The CdS cell was placed in series with a 47 kOhm resistor, and the signal was taken between them. The signal then ranged from 0 to Vcc/2 or 2.5 volts as the CdS resistance varied.
AMPLIFICATION
We chose the inverting configuration of a TLCV2772 (manufactured by Texas Instruments) rail-to-rail operational amplifier as it is common to use this kind in single supply design. These amplifiers can output voltages quite near the power supply voltage or “rail.” And since we wanted to measure the changes of the 2.5 voltage signal due to the blood flow, we needed to amplify the changes rather than the entire signal. We also needed the signal in the 0-5V range after amplification, rather than being centered around 0V. A virtual ground was employed to achieve this by amplifying the changes with respect to the Vcc/2 volts. A TLE2426 rail-splitter (also from Texas Instruments) was used and attached to the positive terminal of the op-amp to function as a virtual ground. Below is a diagram of the design constructed so far.
Read More: MEASURING HEART RATE USING A PHOTOPLETHYSMOGRAPHIC CARDIOTACHOMETER
- How does a photoplethysmograph measure heart rate?
It measures the variation of light passing through a finger caused by the pulsatile nature of blood flow. - What component detects the amount of light in the system?
The Cadmium Sulfide (CdS) cell detects light intensity, as its resistance varies with the light hitting it. - Why was an operational amplifier necessary in this design?
The raw signal variation was only 10mV, so amplification was required to reach the 0-5 V range for the A/D converter. - How is the signal converted from resistance to voltage?
The CdS cell is placed in series with a 47 kOhm resistor, and the signal is taken between them to create a voltage range of 0 to 2.5 volts. - What role does the TLE2426 rail-splitter play in the circuit?
It functions as a virtual ground attached to the positive terminal of the op-amp to allow amplification relative to Vcc/2. - How does the system indicate heart rate to the user?
In one mode, LEDs light up based on light detection; in another, they indicate specific beats per minute ranges calculated by the microcontroller. - What power supply configuration was used for the circuit components?
A single supply design with Vcc set to 5 volts was required to power all components. - Why was the TLCV2772 operational amplifier chosen?
It is a rail-to-rail op-amp common in single supply designs that can output voltages near the power supply rails.