Summary of Eye Diagram Basics: Reading and applying eye diagrams
High-speed digital signal integrity is critical due to gigahertz frequencies and complex design variables. Engineers use oscilloscopes to generate eye diagrams, which overlay data stream segments to visualize channel imperfections like crosstalk, impedance mismatches, and timing errors. This technique helps locate interference sources from PCB traces, connectors, or cables by analyzing amplitude and timing degradation at specific probe points.
Parts used in the Eye Diagram Analysis:
- Oscilloscope
- Serial digital signal transmitter
- PCB traces
- Connectors
- Cables
- IC pins
- Master clock
- Oscilloscope probe
Accelerating data rates, greater design complexity, standards requirements, and shorter cycle times put greater demand on design engineers to debug complex signal integrity issues as early as possible. Because today’s serial data links operate at gigahertz transmission frequencies, a host of variables can affect the integrity of signals, including transmission-line effects, impedance mismatches, signal routing, termination schemes, and grounding schemes. By using an oscilloscope to create an eye diagram, engineers can quickly evaluate system performance and gain insight into the nature of channel imperfections that can lead to errors when a receiver tries to interpret the value of a bit.
 A serial digital signal can suffer impairments as it travels from a transmitter to a receiver. The transmitter, PCB traces, connectors, and cables will introduce interference that will degrade a signal both in its amplitude and timing. A signal can also suffer impairments from internal sources. For example, when signals on adjacent pairs of PCB traces or IC pins toggle, crosstalk among those signals can interfere with other signals. Thus, you need to determine at what point to place the oscilloscope probe in order to generate an eye diagram that will help you locate the source of the problem. Furthermore, where you place an oscilloscope’s probe will produce differing signals on the display.
Generating an eye diagram
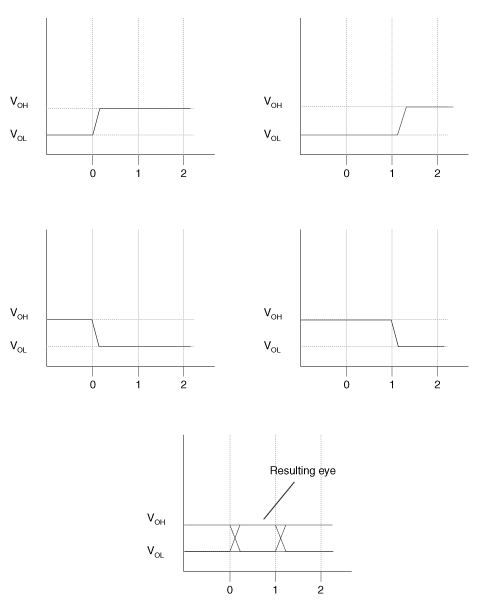
An eye diagram is a common indicator of the quality of signals in high-speed digital transmissions. An oscilloscope generates an eye diagram by overlaying sweeps of different segments of a long data stream driven by a master clock. The triggering edge may be positive or negative, but the displayed pulse that appears after a delay period may go either way; there is no way of knowing beforehand the value of an arbitrary bit. Therefore, when many such transitions have been overlaid, positive and negative pulses are superimposed on each other. Overlaying many bits produces an eye diagram, so called because the resulting image looks like the opening of an eye.
In an ideal world, eye diagrams would look like rectangular boxes. In reality, communications are imperfect, so the transitions do not line perfectly on top of each other, and an eye-shaped pattern results. On an oscilloscope, the shape of an eye diagram will depend upon various types of triggering signals, such as clock triggers, divided clock triggers, and pattern triggers. Differences in timing and amplitude from bit to bit cause the eye opening to shrink.
For more detail: Eye Diagram Basics: Reading and applying eye diagrams
- Why are engineers required to debug signal integrity issues early?
Accelerating data rates, greater design complexity, standards requirements, and shorter cycle times put greater demand on design engineers. - What variables affect the integrity of signals in serial data links?
Transmission-line effects, impedance mismatches, signal routing, termination schemes, and grounding schemes can affect signal integrity. - How does an oscilloscope create an eye diagram?
An oscilloscope generates an eye diagram by overlaying sweeps of different segments of a long data stream driven by a master clock. - What causes the eye opening to shrink in an eye diagram?
Differences in timing and amplitude from bit to bit cause the eye opening to shrink. - Can internal sources cause signal impairments?
Yes, crosstalk among signals on adjacent pairs of PCB traces or IC pins can interfere with other signals. - Where should you place an oscilloscope probe?
You need to determine at what point to place the oscilloscope probe to generate an eye diagram that will help locate the source of the problem. - Does the triggering edge affect the displayed pulse?
The triggering edge may be positive or negative, but the displayed pulse that appears after a delay period may go either way. - What do ideal eye diagrams look like?
In an ideal world, eye diagrams would look like rectangular boxes.