Hello everybody welcome back . Today I’m gonna tell how you can display temperature with bar graph on Graphic LCD using PIC microcontroller . The project is very simple to understand if you have concept of
Graphic LCD .The program in this project is written in C and Assembly level language & the compiler used to write the C code is mikroC PRO for PIC V. 7.1.0 .You can download complete project (C and Asm file with proteus8 file ) from this link temperature on GLCd .
Graphical Liquid Crystal (GLCD)
Graphical lcds are different from the ordinary alphanumeric lcds, like 16×1 16×2 16×4 20×1 20×2 etc. They (ordinary) can print only characters or custom made characters. They have a fixed size for displaying a character normally 5×7 or 5×8 matrix. Where as in graphical lcd we have 128×64=8192 dots each dot can be lit up as our wish or we can make pixels with 8 dots ie. 8192/8=1024 pixels. We can design a character in a size which we need. More over we can make a picture on a graphical LCD as well. you can learn more about this LCD on this link Graphic LCD
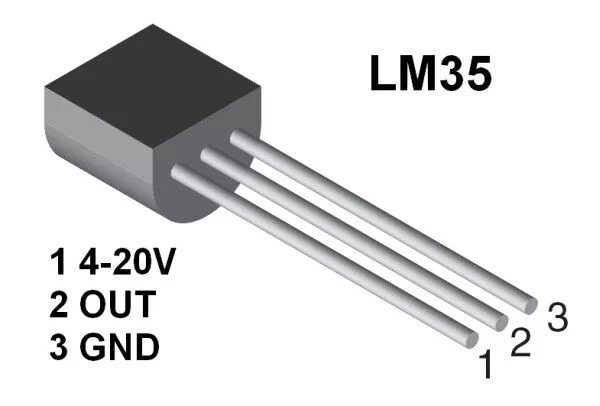
LM35 Temperature Sensor
The LM35 temperature sensor is a semiconductor sensor. It is available in integrated circuit (IC) form. It has 3 pins and the IC is as shown below.
VT = kT/q
Features of LM35:
- Calibrated directly in Celsius scale ( Centigrade)
- Linear +10 mV/0C scale factor
- 50C Ensured Accuracy (at 250C)
- Works for -550C to 1500C
- Operates in the range of 4V to 30V
- Less than 60µA design drain current
- Low impedance output, 0.1Ω for 1-mA load
- Low self heating, 0.80C in still air
Display temperature on Graphic Liquid Crystal Display using PIC16F877A Microcontroller (Code)
// Glcd module connections

char GLCD_DataPort at PORTD;

sbit GLCD_CS1 at RC0_bit;

sbit GLCD_CS2 at RC1_bit;

sbit GLCD_RS  at RB3_bit;

sbit GLCD_RW  at RB4_bit;

sbit GLCD_EN  at RB5_bit;

sbit GLCD_RST at RE2_bit;

sbit GLCD_CS1_Direction at TRISC0_bit;

sbit GLCD_CS2_Direction at TRISC1_bit;

sbit GLCD_RS_Direction  at TRISB3_bit;

sbit GLCD_RW_Direction  at TRISB4_bit;

sbit GLCD_EN_Direction  at TRISB5_bit;

sbit GLCD_RST_Direction at TRISE2_bit;

// End Glcd module connections

char txt[4];

unsigned tmp;

void main() {

Glcd_Init();

Glcd_Fill(0);

ADC_Init();

while(1){

tmp = ADC_Read(0);

tmp = tmp/2.05;

ByteToStr(tmp, txt);

Glcd_Write_Text("o", 60,0, 1);

Glcd_Write_Text(txt, 35,1, 1);

Glcd_Write_Text("TEMP =", 0,1, 1);

Glcd_Write_Text("C ", 70,1, 1);

if (tmp>20) {Glcd_Box(10, 50, 20, 70, 1); }

if (tmp<20) {Glcd_Box(10,50, 20, 70, 0); } if (tmp>40) {Glcd_Box(20, 45, 30, 70, 1); }

if (tmp<40) {Glcd_Box(20, 45, 30, 70, 0); } if (tmp>60) {Glcd_Box(30, 40, 40, 70, 1); }

if (tmp<60) {Glcd_Box(30, 40, 40, 70, 0); } if (tmp>80) {Glcd_Box(40, 35, 50, 70, 1); }

if (tmp<80) {Glcd_Box(40, 35, 50, 70, 0); } if (tmp>100) {Glcd_Box(50, 30, 60, 70, 1); }

if (tmp<100) {Glcd_Box(50, 30, 60, 70, 0); } if (tmp>115) {Glcd_Box(60, 25, 70, 70, 1); }

if (tmp<115) {Glcd_Box(60, 25, 70, 70, 0); } if (tmp>130) {Glcd_Box(70, 20, 80, 70, 1); }

if (tmp<130) {Glcd_Box(70, 20, 80, 70, 0); } if (tmp>140) {Glcd_Box(80, 15, 90, 70, 1); }

if (tmp<140) {Glcd_Box(80, 15, 90, 70, 0); } if (tmp>145) {Glcd_Box(90, 10, 100, 70, 1); }

if (tmp<145) {Glcd_Box(90, 10, 100, 70, 0); }

}

}
Display temperature on Graphic Liquid Crystal Display using PIC16F877A Microcontroller (Schematic Diagram)
Short Description
The code is very easy to understand . First we have defined Control and DATA pins of graphical LCD to PIC microcontroller . Then after we have displayed some text using function Glcd_Write_Text(“”, ,,); .Since we cannot write box using Glcd_Write_Text(); function we have to make our own box using the function Glcd_Box(x,y,-x,-y,on/off). These box are made to respective temperature and the box is used to represent the temperature . Thats all concept behind this project .
If you have any question about this project please comment below , if you like this project please share this .