Summary of Building a MicroPython heart rate monitor | Finding the beat in HR sensor data
This article describes building a heart rate monitor using a PulseSensor.com sensor and a Wemos D1 board running MicroPython. The device displays pulse, beats per minute (BPM), and a trace on an OLED screen. It explains the photoplethysmography (PPG) principle and details an algorithm using auto-adjusting thresholds to detect heartbeats despite signal variability caused by ambient light or skin tone.
Parts used in Heart Rate Monitor:
- PulseSensor.com sensor
- Wemos D1 board
- OLED display
- MicroPython environment
Pulse sensors have become popular due to their use in health-monitors like the Fitbit. The sensors used are cheap, simple and pretty reliable at getting a reasonable indication of heart rate in daily use. They work by sensing the change in light absorption or reflection by blood as it pulses through your arteries — a technique jauntily named photoplethysmography (PPG). The rising and falling light signal can be used to identify the pulse, and subsequently, calculate heart rate.
Most commercial sensors (Fitbit, etc.) use green-light based sensors and similar sensors are available for use in your own projects. In this project we’re taking a Pulsesensor.com sensor and using it to build a working heart monitor with OLED pulse, BPM and trace display, using MicroPython on a Wemos D1.
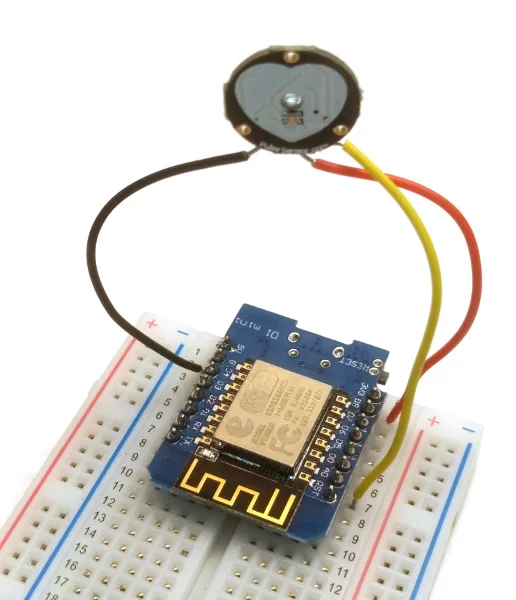
Wiring up the sensor
In this project we’re using an Wemos D1 and a Pulsesensor.com heart rate sensor, but other boards and sensors will also work fine. Wire up the sensor as follows, with the signal (S) pin connected to your board’s analoge input.
Detecting a peak by sight is straightforward: the signal rises on a beat, and falls between beats, repeatedly reaching maximum and minimum values. However, biological variability makes things doing this automatically a little trickier. Firstly, the maximum and minimum values are affected by multiple things including ambient light, skin colour, depth and size of blood vessels. Secondly, the magnitude of the peaks is affected by the strength of the pulse, and depth of any arteries. Thirdly, the distance between peaks is non-constant: even for a perfectly healthy person, the heart will occasionally skip beats, or the sensor will miss them.
To detect the beat we have a couple of options —
- Detect the signal being over/under a threshold. Simple to implement, but the threshold must adjust to account for use variation.
- Detect the signal rising or falling (for N number of ticks) Bit trickier to implement, less affected by threshold issues, more affected by noise (transient dips).
Here we’re going to use the first method, accounting for variation by using a pair of auto-adjusting threshold. We will count a pulse when the value rises 3/4 of the way to the current maximum and a pulse ends when the value falls below 1/2 of the current maximum.
Optimization
To understand why these values were selected, see the following plots. Below is a plot of pulse data (blue) alongside maxima and minima (purple, red) and the current threshold for the given window (grey). This uses a windowsize of 50 samples, and as you can see the maxima & minima bounce around, pulling the threshold all over.
Read More: Building a MicroPython heart rate monitor | Finding the beat in HR sensor data
- How does a pulse sensor work?
It senses changes in light absorption or reflection by blood pulsing through arteries, a technique called photoplethysmography. - What type of light do most commercial sensors use?
Most commercial sensors like Fitbit use green-light based sensors. - Can other boards be used besides the Wemos D1?
Yes, other boards and sensors will also work fine for this project. - Why is automatic peak detection tricky?
Biological variability makes it tricky because values are affected by ambient light, skin color, vessel depth, and non-constant distances between peaks. - What method is used to detect the beat in this project?
The project uses a method where a pulse is counted when the value rises 3/4 of the way to the current maximum and ends when it falls below 1/2 of the current maximum. - What factors affect the magnitude of the peaks?
The magnitude is affected by the strength of the pulse and the depth of any arteries. - Does the distance between peaks remain constant?
No, the distance between peaks is non-constant even for healthy people due to skipped beats or missed detections. - What is the purpose of the window size in the optimization plot?
The window size determines how many samples are used to calculate maxima and minima which pull the threshold up and down.