Summary of An Inexpensive Microcontroller Based Data Logging System
This article describes a low-cost, microcontroller-based data logger using a PIC 16C73A and 24LC32A EEPROM to record analog sensor voltages at programmable intervals. The system separates a low-power logger and an RS-232 reader, stores >4000 samples, runs weeks on 4 AA batteries, and is adaptable to many sensors (thermistor thermometer example provided). Software coordinates host, reader, and logger for initialization and download; data are stored as ASCII files for calibration and analysis. Schematics, software, and parts lists will be made available online.
Parts used in the Data Logger System:
- PIC 16C73A microcontroller (Microchip Technology, Inc.)
- 24LC32A serial EEPROM (Microchip Technology, Inc.)
- MAX232A RS-232 transceiver (Microchip Technology, Inc.)
- 7805A voltage regulator
- Solid state relay (Aromot AVQ 210E)
- Thermistor (variable resistor for thermometer application)
- Fixed resistor for voltage divider (RF)
- Optional sensor LED
- 4 AA or 4 C batteries (power for logger)
- 9 V battery (power for reader and sensor circuit)
- Telephone cable and modular connectors
- RS-232 9-pin female connector
- Printed circuit boards for logger and reader
- Supporting passive components (resistors, capacitors, etc.)
INTRODUCTION
Attempts to understand and analyze environmental variables need data sets that track both temporal and geographical changes. These data can be collected using networks of recording instruments or instruments connected to commercially available data loggers (e.g., Silliman and Booth, 1993), but the cost of such networks is typically in the thousands to tens of thousands of dollars and may necessitate the development of software to interface between the data logger and a host computer (e.g., Mukaro and Carelse, 1997). The expensive price of these networks, along with the dangers of vandalism and theft involved with their placement in distant areas, precludes their widespread usage, even in studies that would obviously benefit from them. This note covers a low-cost, simple-to-assemble microprocessor-based data Logging System that is currently being adapted for a variety of field applications (Dedrick, 1998). The inexpensive cost of this system, together with the rising availability and reducing cost of a broad variety of appropriate sensors, could allow more researchers and educators to collect temporal and spatial data systems without requiring a significant budget.
Our system is based on Microchip’s PIC 16C73A microcontroller and: (1) digitizes and records an analog voltage from a sensor at programmable sample periods ranging from a few seconds to many hours, (2) stores over 4000 digital data values, (3) logs data for a number of weeks or more using 4 AA alkaline batteries, (4) is easily adaptable for use with a variety of sensors, and (5) is inexpensive. Individual data loggers may be built for less than $20 per device and constructed in less than an hour on a printed circuit board. In this note, we explain the system, define its distinguishing features, and demonstrate its use as a recording thermometer.
OVERVIEW OF THE DATA LOGGER SYSTEM
Our data logging system is made up of two distinct devices, a “logger” and a “reader,” both of which communicate with a host computer (Fig. 1).
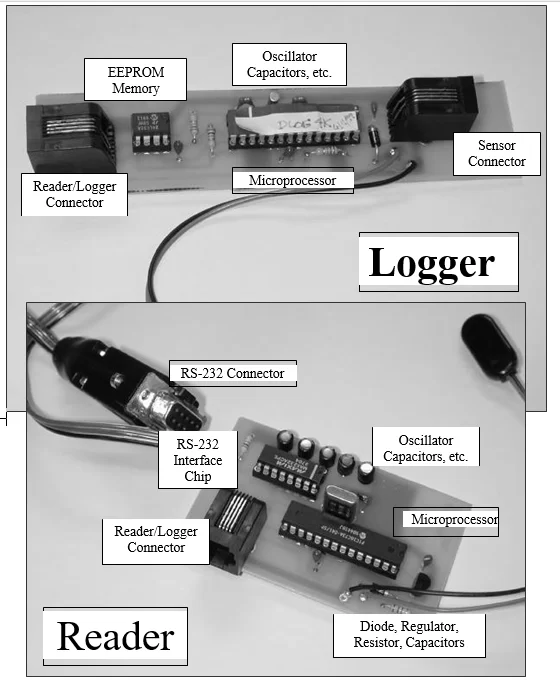
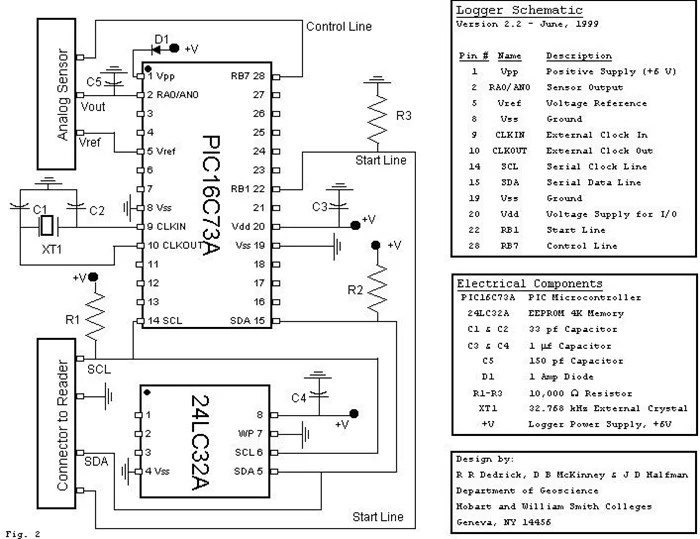
The logger is a 3 x 13 cm circuit board that contains an 8-bit microcontroller chip (PIC 16C73A, Microchip Technology, Inc.), a non-volatile serial EEPROM memory chip (24LC32A, Microchip Technology, Inc.), and other supporting components (Fig. 2).
Four AA or four C batteries are used to power the device. The logger transforms an analog voltage signal from an external sensor into a digital value, which is then stored in the logger’s EEPROM memory at user-specified sample intervals. The “reader” is a separate 5 x 7.5 cm circuit board that contains the same microcontroller, an RS-232 transceiver interface chip (MAX232A, Microchip Technology), and supporting components (Fig. 3). A 9 V battery controlled to 5 V provides power (7805A regulator).
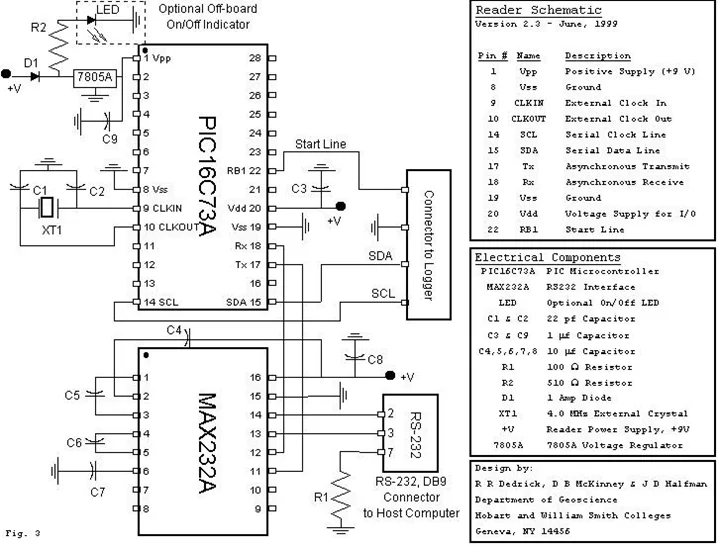
The reader allows communication between the logger and a “host” PC-compatible computer by connecting one cable to the logger and another to the host computer’s RS-232 serial port. The authors wrote a Windows-based application that, using commands provided to the reader and transmitted to the logger’s memory chip, initializes the logger at the start of data collection and retrieves data once sampling is complete. A logger is typically linked to the reader for initialization, then unplugged, connected to the sensor and deployed in the field for data collection, and then reconnected to the reader to download and store the data on the host computer.
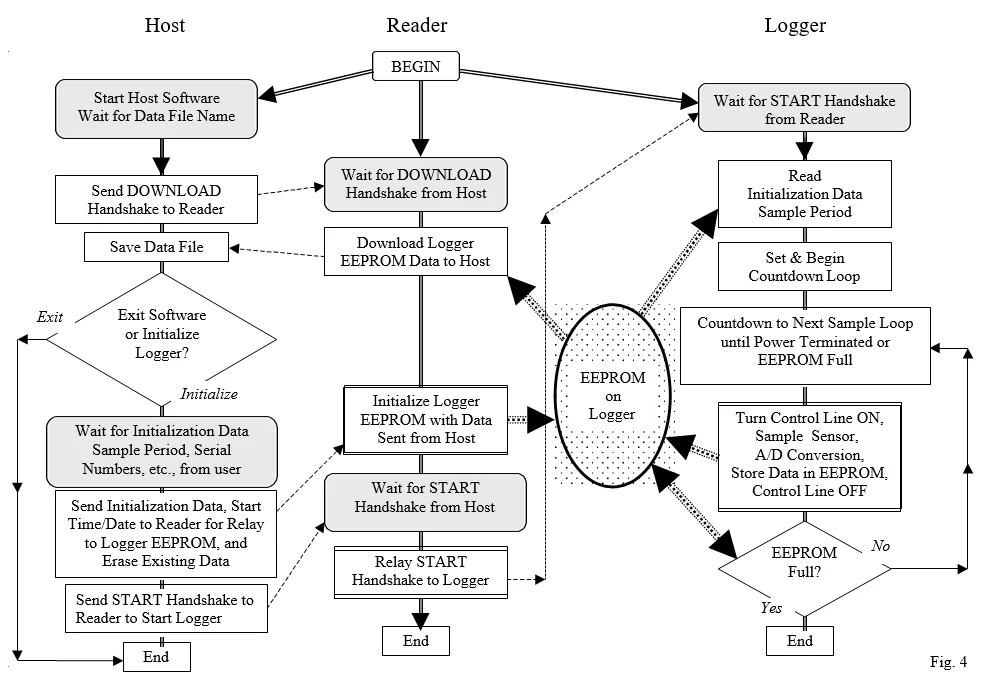
The system’s operation is dependent on coordinated software running on the host computer, reader, and logger. Figure 4 depicts the software functions of the host, reader, and logger (vertical columns), as well as how the three programs are linked via software “handshakes” (links between columns).
Finally, the digitized sensor data is stored as a character-delimited(“^”), ASCII text file on the host computer. The sensor data in this file are uncalibrated values ranging from 0 to 255, reflecting the microcontroller’s onboard analog to digital converter’s 8-bit resolution. This file also contains user-supplied deployment remarks (for example, field location), sensor and logger information (for example, serial numbers), start time, start date, sample period, memory state, and sample times. This text file may be easily imported and analyzed in a spreadsheet. Most applications, for example, will demand that the file’s digital sensor data be translated to standardized units (temperature, stage height, pressure, and so on) using a calibration function. Appendix 1 has an example data file.
FEATURES AND ADVANTAGES OF THE SYSTEM
Several aspects of the system deserve special attention, including the use of the PIC 16C73A microcontroller, the serial EEPROM chip for data storage, the separate reader and logger, the system’s low cost, the software design of the data download and initialization functions, and the logger’s adaptability to a wide range of sensor types.
The 8-bit PIC 16C73A microcontroller (Microchip Technology, Inc.) is ideal for a low-cost data logger. It has an analog-to-digital converter, hardware and software support for serial connection and EEPROM data storage, an inbuilt programmable timer that can run in the background but generates time-out interrupts, and extremely low power consumption. In our setup, two identical microcontrollers are used, one in the scanner and one in the logger. The reader’s microcontroller runs at 4 MHz to facilitate serial connection with the host computer at 2400 baud. The logger’s microcontroller, on the other hand, works at a slower clock speed of 32.768 kHz to simplify timing tasks and minimize power consumption. We measured the logger’s operational current to be less than 2 mA. Assuming a 4 AA alkaline battery pack with 2140 mAh capacity (Glover, 1989), this offers a potential 44-day working supply (currently, 15 days is our maximum field trial duration). User-selected sample durations are implemented using two internal, cascaded 8-bit counters that give sample times ranging from 8 seconds to any multiple of 8 seconds up to about 6 days (8 seconds x 28 x 28). The PIC microcontroller costs less than $10 and is available from a variety of vendors.
The usage of a separate reader and logger is not required, although it is useful for a number of reasons. Segregating host communications functions into the reader: (1) reduces the number of components and complexity of the logger, lowering the cost of each logger; (2) allows the logger to operate at the lower, power-saving clock frequency discussed above; and (3) allows a single reader to service many loggers, lowering the total cost significantly in the typical situation where a project requires multiple measurement sites (many loggers). Components for the logger, excluding the housing, cost less than $20, while parts for the reader cost less than $35. Here you find more Clock Generators.
The logger memory is a serial EEPROM chip (24LC32A, Microchip Technology, Inc.). It’s a low-cost, low-power storage device that’s designed to work with the PIC microcontroller. This 4K EEPROM has 4096 memory addresses, each of which may store an 8-bit integer, or a digital value ranging from 0 to 255. Furthermore, it provides non-volatile storage for the data collector Even if the logger’s power supply is turned off for a lengthy period of time, the data remains in the EEPROM and may be recovered. This chip only requires a “2-wire” interface with the microcontroller, a serial data line (SDA), and a serial clock line (SCL), considerably simplifying the remaining circuitry and thereby lowering the system cost. It also enables the reader and the logger to independently access the EEPROM, so that when the logger is connected to the reader, the reader stores and retrieves information directly to or from the logger’s EEPROM rather than relaying the data through the logger microcontroller. This reduces the complexity of the logger circuitry and software.
Because our software architecture integrates data transmission and initialization tasks, the host computer always sends data from the logger before allowing startup. This is in contrast to the functioning of generic data loggers, which may separate data transmission and setup. A generic data logger’s operation normally consists of three stages: initializing the logger with the date and sample information, deploying the logger and a connected sensor, retrieving the logger, and transferring the data to the host computer. The combined download and initialization methods in our system limit the possibility of reinitializing a logger before the data from a prior deployment has been delivered. Thus the operation of our system has two stages: transfer of data followed by the option to reinitialize the logger for a new deployment.
Our technology is adaptable to a diverse and expanding set of sensors. We have tested it with temperature, pressure, and light intensity sensors so far, and the temperature application is discussed in detail below. The logger may be linked to virtually any sensor that generates an analog voltage signal from the ground (Vss) to a positive supply (Vpp). The approximate range in our instance is 0 to 6 volts. The onboard analog-to-digital converter of the microcontroller generates an 8-bit digital value equal to the ratio of the analog signal to a voltage reference (minimum reference voltage is 3 volts). As a result, the system may possibly deliver a resolution of 0.5% (1/256) of the reference voltage. Experiments with three different loggers tested at 25°C and 3°C over periods of two or three days indicate that the time-of-sample errors are less than 12 seconds per day.
The microcontroller additionally provides a sensor “control line” logic output to enhance sensor battery life. This output is coupled to a solid state relay (Aromot AVQ 210E) in the temperature sensor configuration described below, which toggles the sensor’s power on and off. When the control line output is high (+Vss), power is provided to the sensor, allowing it to warm up, stabilize, and then send output to the logger microcontroller; when the control line output is low (ground), power is disconnected. All PIC microcontroller connections to the logger between samples are high-impedance inputs that are unaffected by voltage fluctuations in the sensor circuit. When the control line is turned on, an optional sensor LED lights.
Because individual loggers are so inexpensive, our system may be adapted to circumstances requiring multiple input channels or data capacity of more than 4000 samples (4K) per deployment. When numerous channels are needed, just add extra loggers. This is a low-cost approach, costing less than $20 per logger. When more than 4000 samples are required during deployment, two or more loggers are used. This entails utilizing several loggers with the same sample period but staggered start times to sample and record sensor output independently. For the duration of the deployment, each logger records data from its own sensor; the time-staggered data from each logger is then standardized (based on individual logger/sensor calibration curves), combined, and sorted by time within any spreadsheet to produce a single data set with the desired temporal resolution. Because of the low cost of individual loggers, this technique is cost-effective. Another advantage of using several loggers is that full data coverage is provided during the deployment time, even if one logger or sensor fails (though at an increased sample interval).
Though our system offers numerous benefits, its efficient usage necessitates extra care and effort from the part of the user. To begin, while the system will function with a variety of sensors, users must pay close attention to the output of these sensors. The onboard analog-to-digital converter of the microcontroller generates a number between 0 and 255 that is proportionate to the ratio of the analog sensor voltage to a voltage reference. The minimum voltage reference, however, is 3.0 V, while the highest is around 6 V. Sensors that produce voltages outside of this range, or sensors that produce just a small range of voltages within this range (for example, 4.0 to 4.1 V), must be “conditioned” for use with the system.
Linking this sort of sensor to the logger would necessitate the use of an amplifier circuit to increase the sensor’s output into the 0 to 5 V range. Furthermore, the user must create a calibration between the digital values of the analog-to-digital converter and the desired reference units (degree Celsius, pound per square inch, etc.). Calibration has a direct impact on the accuracy and resolution of the final data. The user must also be worried about changes in calibrations caused by the sensor/exposure logger’s to a wide variety of external conditions (temperature, pressure, humidity, and so on). Finally, while measuring rapidly fluctuating signals, users must use caution. The analog-to-digital converter on the microcontroller takes a “instantaneous” sample of sensor output that is assumed to be consistent for at least several milliseconds. The discussion of signal conditioning circuits designed for specific sensors and applications is beyond the scope of this brief essay. Carr (1997) provides an approachable introduction to sensors, analog-to-digital conversion, and signal conditioning.
RECORDING THERMOMETER APPLICATION
Figure 5 depicts a temperature sensor schematic that may be attached to the data logger system to generate a recording thermometer.
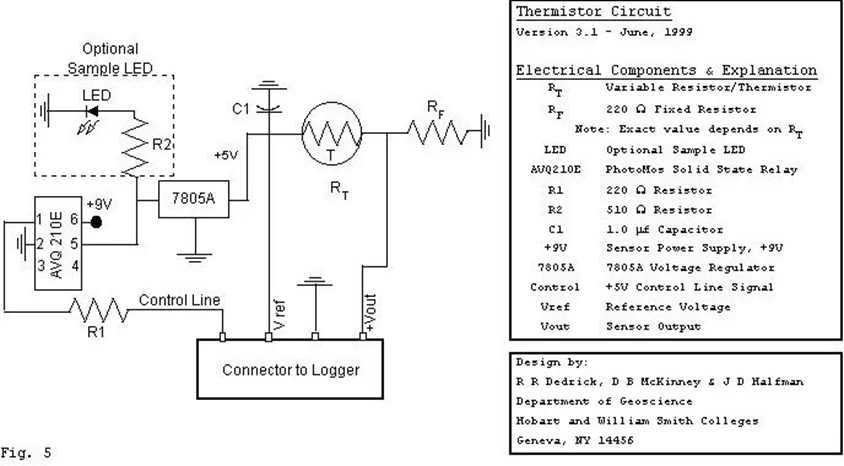
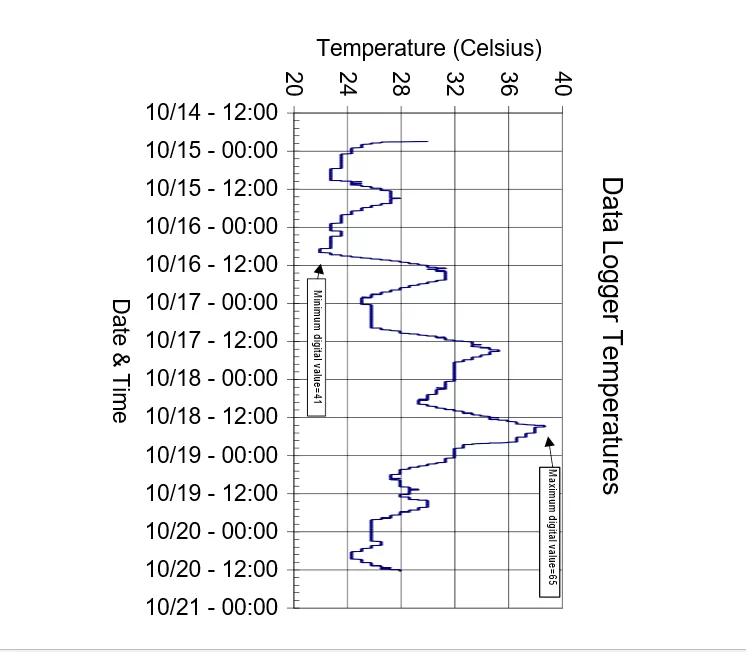
The sensing element in this example is a thermistor connected in series with a fixed resistor to form a voltage divider. The voltage output fluctuates with temperature, as seen in Figure 6, and the calibrated output of our test run. A separate 9 V battery powers the sensor circuit, which is controlled by a 7805A voltage regulator to give a steady 5 V power supply. A controlled supply prevents voltage drift caused by diminishing battery output throughout the deployment duration. The sensor’s “control line” is linked to pin one of the solid-state relays. This configuration switches current flow on and off through the sensing circuit. The sensor and circuitry as shown cost under $10 to construct. The sensor was placed between our lab’s inner and storm windows for around five days in the fall to track daily temperature cycles (Fig. 6). The daily temperature cycle reported by the data recorder is temporally consistent with observed daily and longer-term fluctuations in outside air temperature across the deployment period. The plot also displays greater resolution fluctuations, which are most likely related to the room’s heating cycle and periods of more direct sunlight via the window.
CONCLUSIONS
The data logger system is a low-cost and easy option for collecting temporal and spatial field data for a variety of research and educational purposes. It may be combined with a wide range of accessible sensors. The schematics, circuit board layouts, components list, suppliers, PIC and host software, and other associated items will be made available on a Web site so that any educator or researcher may download enough information to build her/his own data logger. This website will include information on using the logger as a pressure-based recording stream gauge, in addition to the recording thermometer example provided above. Any and all recommendations are appreciated.
- What microcontroller does the data logger use?
The logger uses the PIC 16C73A microcontroller. - How is data stored in the logger?
Data are stored in a 24LC32A serial EEPROM with 4096 8-bit addresses. - Can the logger run for weeks on batteries?
Yes; using 4 AA alkaline batteries the logger can potentially operate for weeks (measured current <2 mA, theoretical ~44 days; field trials up to 15 days). - How does the reader communicate with the host computer?
The reader uses an RS-232 connection via a MAX232A transceiver to connect to the host PC serial port. - Is the system adaptable to different sensors?
Yes; the logger accepts sensors that produce an analog voltage between ground and the positive supply and has been tested with temperature, pressure, and light sensors. - How many samples can one logger store?
Each logger EEPROM stores up to about 4096 samples (4K), with values from 0 to 255. - How are sample intervals implemented?
Sample durations use two internal cascaded 8-bit counters in the PIC to give sample times from 8 seconds up to multiples of 8 seconds (about 6 days maximum). - How is sensor power managed to save battery?
The microcontroller provides a control line that toggles sensor power through a solid state relay, powering the sensor only around sampling times. - How is the recorded data output formatted?
Digitized data are stored as a character-delimited ASCII text file containing sensor data, deployment remarks, start time/date, sample period, and other information. - What must users do to translate logged values to physical units?
Users must calibrate the digital ADC values to desired units (for example, degrees Celsius) using a calibration function.