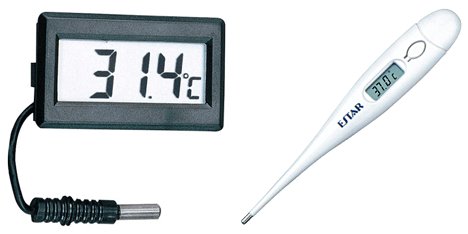
Temperature sensors are used in a wide range of electronic devices, including digital thermometers, home thermostats, ovens, and refrigerators. Figure 1 shows two devices with temperature sensors.
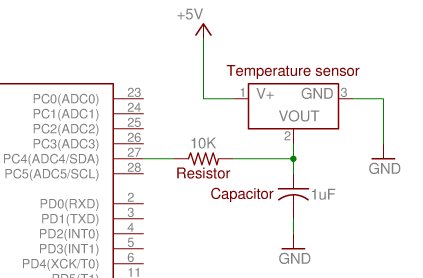
The temperature sensor provided in your kit is a precision analog sensor, whose voltage output is linearly proportional to the temperature. Configured as described here, the sensor has an operating range of about 0°C to +150°C.
 Connecting the Temperature Sensor
The temperature sensor is a three-pin integrated circuit. When the device’s flat side is facing towards you, the three pins are labeled 1, 2, and 3, from left to right, as shown in Figure 2.
Depending on your kit, you may have either an LM35 temperature sensor or an LM335 temperature sensor. You can identify your sensor by reading the text on the flat face of the device, as shown in Figure 3. The two sensors are wired slightly differently on the breadboard and produce different analog outputs, so it is critical to identify which type you have before moving ahead.
Reading and Plotting Temperature Data
Using MATLAB, it is possible to plot data gathered from the ATmega microcontroller. Using the ms.adc_read command, you can have MATLAB gather data from the temperature sensor and display the temperature over time as an x-y graph.
 1. Send command prompt instructions to read the ADC value from the temperature sensor:
>> data=ms.adc_read(4); %Set data equal to temperature value
>> data %Display the current value for the temperature
2. Write a program in the editor window to plot the data from the temperature sensor:
delete(ms)
endms=msci.breadboardkit(‘COM#’) %Connect to com port
msdefines %Ensure you have ms objects
for i=1:60 %Start a loop with 60 cycles
pause(1) %Pause for 1 second
data=ms.adc_read(4) %Read the analog value
plot(i, data, ‘rs’) %Plot the iteration and the value
drawnow %Draw all points plotted so far
hold on %Keep the same graph on the screen
axis([0 60 0 40]) %Set the x and y axis extentsend
xlabel(‘Time (s)’); %Label the x axis as Time
ylabel(‘Analog Value’); %Label the y axis as Analog Value