


Summary of USB data logger project using pic-microcontroller
This project utilizes a PIC 18F4550 microcontroller to create a USB-based oscilloscope, enabling computer-controlled gain and offset adjustments via software. The system employs bulk data transfer over USB for efficient sampling at 16kHz, capturing signals between 2Hz and 4kHz. It features dual channels with analog circuits for signal conditioning, including multiplexed resistor networks for gain selection and anti-aliasing filters. Software calculations like FFT and cursor analysis are displayed on the PC interface, allowing users to manipulate settings and view plots directly without physical potentiometers.Parts used in the PIC 18F4550 Oscilloscope:
- PIC 18F4550 Microcontroller
- TLC7524C Digital-to-Analog Converter (DAC)
- AD558 Digital-to-Analog Converter (DAC)
- Operational Amplifiers (Op-Amps)
- Multiplexer
- Resistor Sets (for Gain Selection)
- Capacitors (for High Frequency Cutoff)
- USB Interface
- Computer User Interface Software
Introduction:
In this project, PIC 18F4550 is programmed to perform the function of an oscilloscope. Communication is set up between the computer and the PIC through USB, so that bulk data transfer mode is implemented. Analogue circuits are carefully designed so the user can select gain and offset on the computer screen and have the circuit perform the corresponding functions. Also software based calculations like FFT and cursor information can be displayed on the screen. It is also possible to copy and paste the plot to notepad directly.
Hardware Design:
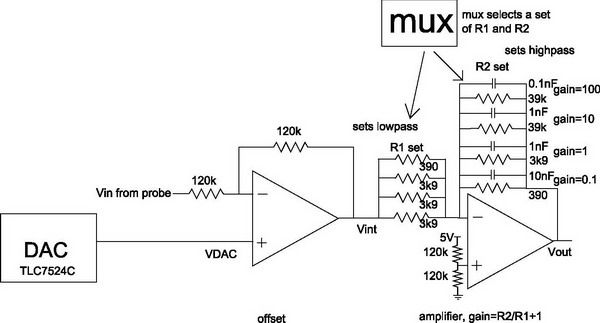
The goal of the hardware is to let the user select offset and gain from the computer user interface rather than twisting a little potentiometer. The design is shown in Graph 1 below. The computer enables the DAC and puts an 8-bit number onto the DAC data lines. The DAC output is sent to the "'+"' input of the first op-amp, providing an offset.
he second op-amp sets up the gain stage. There are four sets of resistors. A multiplexer is used to select one set only at a given time. The value of R_1 and R_2 sets up the gain provided that the "'+"' end is set at 2.5V. To mimic a real oscilloscope, we chose four options for the gain: 0.1, 1, 10, and 100. Capacitors that are parallel to the resistors right before the output stage set the high frequency cutoff of the circuit. The high frequency cutoff is set to be around 4kHz. This is lower than twice the fastest sampling frequency the circuit can perform, and thus eliminates aliasing problems. The schematic for the circuit is shown in Graph 2 below.
It is to be noted that this is the circuit for one oscilloscope probe. Since we have two channels, the same circuit is supposed to be repeated twice. However, due to mistakes made in a long soldering session, one of our TLC7524Cs got destroyed. Luckily, we had another DAC called AD558. It works a little differently than TLC7524C. The output range for AD558 is [0-2.56V] other than [0-5V]. An additional times 2 multiplier op-amp is added after AD558. The circuit is shown in Graph 3 and schematic in Graph 4 below. The bill of material for ordering from Farnell is attached as Graph 5 below.
Communications Protocol:
We are using the 8-bit configuration for the ADC inside the microcontroller, because it offers a good tradeoff between conversation time and resolution.
Bulk data transfer mode is used for transferring data through USB. 256 bytes of data is sent every time through USB. (This is the upper limit we measured.) There are in total 40 lots of 256 bytes. Taking into account 40 bytes as command bytes, (for every 256 bytes, there is one command byte) we end up with 10,200 bytes of data, (256x40-40=10,200) of which we display 10,000. Data is transferred very efficiently this way.
The added communication commands are summarized below:
GET_ADC_COMMAND(command byte is 0xAA)
Software interface sends: {0xAA, channel number}(2 bytes)
Hardware returns: {0xAA, input data}(63, 64, 64 bytes)
READ_COMPARE(command byte is 0xBA)
Software interface sends: {0xBA, channel number}(2 bytes)
Hardware returns: {0xAA, CMCON register, input data}(3 bytes)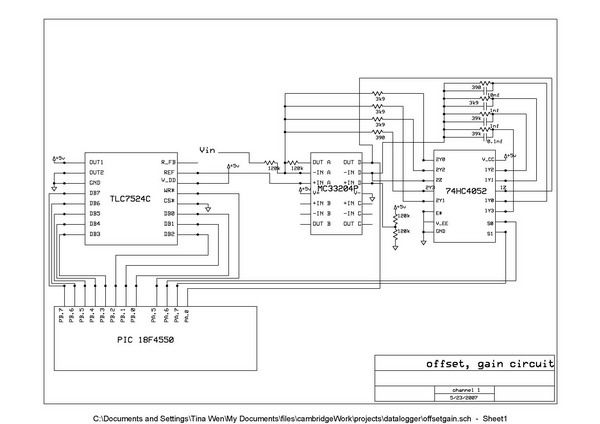
SET_PROPERTIES(command byte is 0xCA)
Software interface sends: {0xCA, compare value, channel 1 offset, channel 1 gain, channel 2 offset, channel 2 gain}(6 bytes)
Hardware returns: {0xAA}(1 byte)
Firmware Design:
A flow chart for firmware can be found in Graph 6 below.
The hardware specification is shown in Table 1.
| Sampling frequency | 16kHz |
| Input frequency range | [2Hz-4kHz] |
| Input voltage range | [0V-5V] |
| Resolution | 9.78x 10^(-3)V |
| Gain | [0.1-100] |
For more detail: USB data logger project
Quick Solutions to Questions related to PIC 18F4550 Oscilloscope:
-
How is communication established between the computer and the PIC?
Communication is set up through USB using bulk data transfer mode. -
What method is used to select gain and offset?
Users select gain and offset from the computer screen rather than using physical potentiometers. -
Why is the high frequency cutoff set to around 4kHz?
It is set lower than twice the fastest sampling frequency to eliminate aliasing problems. -
What happens if a DAC chip gets destroyed during assembly?
An alternative DAC called AD558 can be used, which requires an additional times 2 multiplier op-amp due to its different output range. -
How much data is transferred every time through USB?
256 bytes of data are sent every time through USB, which is the measured upper limit. -
What commands are available for the hardware interface?
The available commands include GET_ADC_COMMAND, READ_COMPARE, and SET_PROPERTIES. -
What is the sampling frequency of the circuit?
The sampling frequency is 16kHz. -
Can the plot be copied to other applications?
Yes, it is possible to copy and paste the plot directly to notepad.
Related projects
PICDEM FS USB CDC Evaluation Board using PIC18F4550 with Proteus Simulation
Introduction The PICDEM FS USB CDC Evaluation Board is a practical microcontroller project built around the PIC18F4550, designed to demonstrate USB communication...
Peripheral Tutorials · PIC18F4550PICDEM FS USB Mass Storage Device using PIC18F4550 with Proteus Simulation
Introduction This microcontroller project demonstrates how to simulate a USB Mass Storage Device (MSD) using the PIC18F4550 in a Proteus simulation environment....
Development Boards & Kits · PIC18F2550Pinguino Project: A PIC Microcontroller Based Arduino
This is a complete tutorial to make a PIC Microcontroller based Arduino. This is a complete tutorial to make PIC microcontroller based...
Communication & Interfacing · PIC18F4520CAN FD Node based on a PIC18 Microcontroller
The introduction sets the stage for an embedded systems project that involves developing a Embedded C CAN FD project using the MCP2517FD...
Communication & InterfacingLAN9662 Gigabit Switch: Optimized for Industrial Ethernet
Introduction It should come as little surprise therefore that one element of what is now more commonly referred to in some circles...
Communication & InterfacingPIC Microcontroller: Fundamentals & Applications for Students
Introduction Microcontrollers are the key components in the embedded systems market. A variety of embedded systems was formed and developed after the...

Ibrar Ayyub
I am an experienced technical writer holding a Master's degree in computer science from BZU Multan, Pakistan University. With a background spanning various industries, particularly in home automation and engineering, I have honed my skills in crafting clear and concise content. Proficient in leveraging infographics and diagrams, I strive to simplify complex concepts for readers. My strength lies in thorough...