Summary of MEASURING HEART RATE USING A PHOTOPLETHYSMOGRAPHIC CARDIOTACHOMETER using pic-microcontroller
This article details the design of a photoplethysmograph to measure heart rate and blood flow using optical sensing. The system converts light variations from a finger into voltage, amplifies the signal, filters noise, and processes it via a microcontroller to display results on an LED ladder. It features two modes: visualizing blood volume and calculating beats per minute (BPM) with real-time feedback for health monitoring and athletic training.
Parts used in the Photoplethysmograph:
- Red LED
- Cadmium Sulfide (CdS) cell
- 47 kOhm resistor
- TLCV2772 operational amplifier
- TLE2426 rail-splitter
- Capacitors (for high-pass and low-pass filtering)
- ADC0804 A/D converter
- PIC16LF873A microcontroller
- 10-LED ladder display
- Push button switch
ABSTRACT
The heart rate is an important measure of health and physical fitness. Medical professionals rely heavily on the rate as a measure of health status and use it to prescribe treatment to individuals. Athletes value the heart rate highly as a tool for regulating frequency and intensity of workouts because the rate provides a quantification of exercise intensity. By looking at the rate, athletes can tailor their workouts to a heart rate target and receive quick feedback. Instant feedback is highly desired for these individuals, and fortunately simple devices can provide that to them.
A plethysmograph is a device that measures the amount of blood in a particular part of the body. A photoplethysmograph performs the task optically by measuring the variation of the amount of light passing through a part of the bodyin our case, a finger caused by the pulsatile nature of blood flow. This measurement allowed us to determine the heart rate by looking at the period of the blood flow.
DESIGN PROCESS
A simple block diagram of the photoplethysmograph system we designed is shown below courtesy of Erik Cheever.
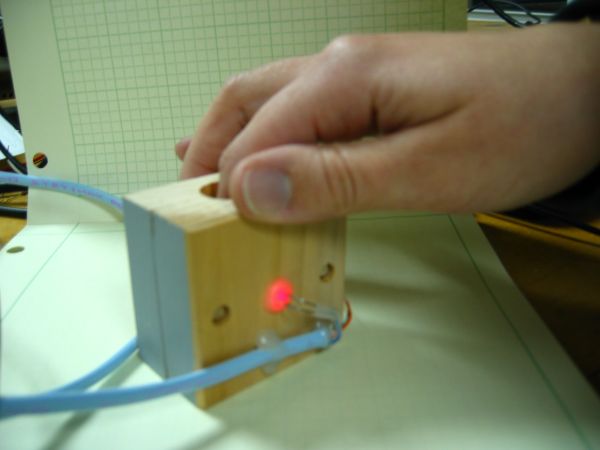
The finger is placed into a box with a red LED on one side and a Cadmium Sulfide (CdS) cell on the other side. The resistance of the CdS cell varies with the intensity of the light hitting it, and this intensity depends on the amount of blood in the finger. The change in the resistance is transduced into a change in voltage, and in its raw form gives a voltage range of 0 to 2.5 volts. We want to measure the variation in this
signal caused by the pulsatility of blood flow in the finger. By carefully examining the raw signal on an oscilloscope, we found that this variation is at most 10mV. This signal must be amplified into a 0-5 V range to take advantage of the full range of the A/D converter. The raw signal also
includes a great deal of noise which must be filtered out. After being converted to digital, the signal is analyzed using the PIC microcontroller, and the output is displayed on a 10-LED ladder. In one mode, the LEDs are set up to all light up when the CdS detects little light from having most of it blocked by the blood flow, and all turn off when encountering much light, corresponding to no fluid. In the second mode, the heart rate in beats per minute (bpm) is calculated from the period of the signal and different LEDs are lighted to indicate the bpm range in which the heart rate falls.
In this section, we have provided an overview of our project. In the following sections, we discuss our design process in greater depth and present our results.
Transduction, Amplification, and Filtration
Single supply design (Vcc = 5V) was required to power the circuit components.
TRANDUCTION
The CdS cell changes resistance in response to the amount of light it receives. To work with this signal requires that it be transduced into a voltage. The CdS cell was placed in series with a 47 kOhm resistor, and the signal was taken between them. The signal then ranged from 0 to Vcc/2 or 2.5 volts as the CdS resistance varied.
AMPLIFICATION
We chose the inverting configuration of a TLCV2772 (manufactured by Texas Instruments) rail-to-rail operational amplifier as it is common to use this kind in single supply design. These amplifiers can output voltages quite near the power supply voltage or “rail.” And since we wanted to measure the changes of the 2.5 voltage signal due to the blood flow, we needed to amplify the changes rather than the entire signal. We also needed the signal in the 0-5V range after amplification, rather than being centered around 0V. A virtual ground was employed to achieve this by amplifying the changes with respect to the Vcc/2 volts. A TLE2426 rail-splitter (also from Texas Instruments) was used and attached to the positive terminal of the op-amp to function as a virtual ground. Below is a diagram of the design constructed so far.
Notice that the inverting configuration was chosen because it can easily be modified to also act as a filter as we shall soon see. A secondary gain stage was implemented using the same configuration to invert the inverted signal from the primary gain stage.
The gain of an inverting amplifier is equal to -Rf/Ri where Rf is the feedback resistance and Ri is the input resistance. Because the gain stages will function with the filtering, we will consider the gain in the next section.
FILTRATION
Once again, the signal we want to end up with consisted of tiny variations (changes in light intensity due to blood flow into and out of the finger), superimposed on a large constant signal (average light flowing through finger). Recall that we only want the time varying part of the signal amplified, and if we were to amplify the raw signal, the DC (constant) part of the signal would saturate the amplifier before obtaining desired amplification of the AC (time varying) part.
To get rid of the DC signal we used a high-pass filter because DC signals are extremely low frequency. We had to be careful, however, not to attenuate the pulse signal, which is usually about 1 Hz (equivalent to one heart beat per second). High frequency noise was a concern as well with most of it coming from the 120 Hz signal of the light fixture (due to positive and negative portions of the 60 Hz power noise). Considering these requirements, a band-pass filter with a frequency band from .5 Hertz to 10 Hertz was chosen. We decided that a second-order simple band-pass filter, which could be implemented by modifying the amplifier design, would be sufficient. A capacitor in series with the input resistance constitutes a high-pass filter, and one in parallel with the feedback resistance constitutes a low-pass. RC values were selectively chosen to set not only the pass-band frequencies, but also the gains as described below.
Gain and Filter Considerations
From looking at the oscilloscope, the amplitude of the AC part of the raw signal was difficult to read. We proceeded to build the first gain stage with the filter built into it having a theoretical gain of 50. We decided to implement the filter in the first stage of the gain with appropriate low and high cutoff frequencies, which was obtained by the following transfer function.
The gain at 1 Hz (aproximately the normal heart beat frequency) was read-off the magnitude plot, and was determined to be 30 dB, equivalent to -31.6 V/V in decimal. We looked at the signal at this point and noticed that the signal peaked at around 100 mV. To obtain the 0 – 5 V range, we built a second stage with a theoretical gain of -50. Thus, the final gain was 1581 by multiplying the intermediate gains. This caused clipping of the signal in some cases, but for the most part the signal avoided that. This method accounted for the fact that signals are different for different individuals by making sure the gain was high enough to amplify weaker signals (David’s signal had a higher amplitude than Heather’s as shown in the results).
The final schematic of the amplification and filtration stages is shown below.
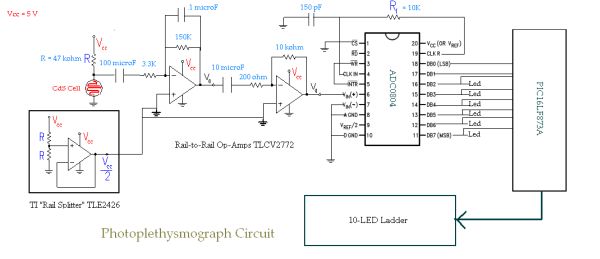
Note that the 10 microFarad capacitor was placed between the two gain stages to decouple the effect of amplifying noise.
THE A/D CONVERTER AND THE PIC MICROCONTROLLER
The analog signal from the amplification and the filter stage must be digitized before it was read into the PIC 16LF873A microcontroller. We chose the ADC0804 to handle the task because of its high resolution (8 bits) and a free running conversion mode. This gave us an indication of how whether the different values of digital values were obtained from a varying signal.
DISPLAYING THE PULSE AND MEASURING THE HEART RATE
Software was written in C-programming language and programmed into the PIC16LF873A to measure the amoung of blood flow in the finger as well as the time between each beat on a 10-LED ladder. The algorithms to perform this task upon a push of a button are explained below.
To display the blood flow measured by the photoplethysmograph we used a ladder of ten LEDs, with the number of lit LEDs increasing as the amount of the blood in the finger increased. This was done by setting a threshold for each LED–the higher the LED on the bar, the higher the threshold and vice versa. When the digital signal went above the threshold for a given LED, the PIC microcontroller would output a logic high, thus lighting the LED. In order to have enough outputs from the PIC to control all the LEDs in the bar, we could only have one input into the PIC. This initiated a switch from the AD0804 to the PIC’s A/D converter to digitize the amplified and filtered analog signal.
In addition to showing the signal using the LEDs, we also wished to display information about heart rate. We did this by lighting 5 LEDs (every other bar on the ladder) to indicate a heart rate above an appropriate threshold (> 40bpm, > 50bpm, etc.). The circuit’s mode of operation (heart rate or pulse) was controlled by a push button on the printed circuit board containing the microcontroller. We used a state machine (see diagram below) to control the process of calculating the number of heart beats per minute (bpm). First, we found the minimum and maximum value of the signal over a 3 second interval, then we chose a low threshold at the minimum value plus a quarter of the range and a high threshold at the maximum value minus a quarter of the range. We started a counter when the signal passed the high threshold from below and stopped the counter when the signal passed the high threshold again after having passed the low threshold. The heart rate, in beats per minute, was then calculated from this period. The displayed heart rate was a weighted average of the current calculation and the previous two (a [1 1 2] filter).
Notice that the thresholds must be determined for each individual since signals are different from finger to finger and person to person. A copy of the C code can be obtained by clicking here.
Below are oscilloscope printouts of the raw signal and the signal for David and Heather after the signal processing.
As evident, the signal processing performed as needed in amplifying the signal to the proper range and removing the inherent noise. The final signal output is an accurate representation of the blood flow variations in the finger that allows for good measurements of heart rate by measuring the period.
The beat period for both subjects was measured on the oscilloscope, and the corresponding BPM values were in the ball park range of expected human BPMs. Using the LED to display blood flow amount and current heart rate was moderately accurate. In pulse mode, the circuit gave very good results, although it sometimes took a while for the signal to settle into a regular cycle. In heart rate mode, the circuit required an extremely regular signal in order to give good results. Overall, the measurements provided insight and instant feedback of heart rate and blood flow to the user.
DEMONSTRATION
An avi file of the photoplethysmograph in action can be viewed by clicking here. The various stages of the circuit can be viewed by clicking here. Note that in the latter video the narrator mistakenly said microsecond when he meant to say millisecond. The Power point presentation given to the class on December 6, 2004 can be accessed here.
FUTURE WORK
The circuit can be made into a printed circuit board (PCB) and used in conjunction with a type of display–an LCD perhaps–to indicate current heart rate more quantitatively. Attaching a 5 volt battery to it, the device can be made mobile, allowing users to carry it any where they may need an instant heart rate measurement. The accuracy of the device could be improved by measuring a few more periods and averaging the durations. The signal to produce these accurate measurements could be made more regular by using a better light sensor. And as a convenience, the thresholds could be dynamically determined and set for each person when they initially place his finger in the box so as to improve universal use and accuracy.
Source : MEASURING HEART RATE USING A PHOTOPLETHYSMOGRAPHIC CARDIOTACHOMETER
- How does the device measure heart rate?
The device measures the period of blood flow pulsatility by detecting light variation through the finger. - What is the function of the CdS cell?
The CdS cell changes resistance based on light intensity, which varies with the amount of blood in the finger. - Why was a band-pass filter chosen?
A band-pass filter from 0.5 Hz to 10 Hz removes DC signals and 120 Hz noise while preserving the pulse signal around 1 Hz. - Can the device be made mobile?
Yes, attaching a 5 volt battery allows the device to be made mobile for instant measurements anywhere. - How is the heart rate displayed?
The heart rate is indicated by lighting specific LEDs on a 10-LED ladder based on calculated beats per minute ranges. - Does the device work for all individuals equally?
No, thresholds must be determined for each individual because signals differ from finger to finger and person to person. - What software language was used for the project?
Software was written in C-programming language and programmed into the PIC microcontroller. - How does the future work suggest improving accuracy?
Accuracy could be improved by measuring more periods, averaging durations, and using a better light sensor.