About this project
Сollect environmental data with Tibbo Project System devices, process it with Azure Stream Analytics and visualize using Power BI.
Things used in this project
|
× | 1 | ||||
|
× | 3 | ||||
|
× | 1 | ||||
|
× | 1 | ||||
|
× | 1 | ||||
|
× | 1 | ||||
|
× | 1 | ||||
|
× | 1 |
 |
|
Story
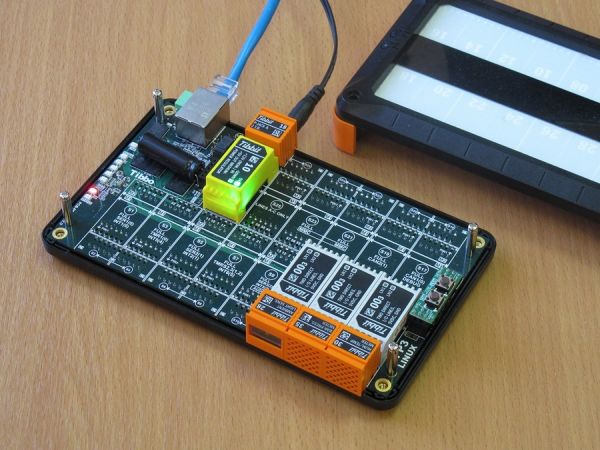
Step 0: Configure and Assemble the TPS
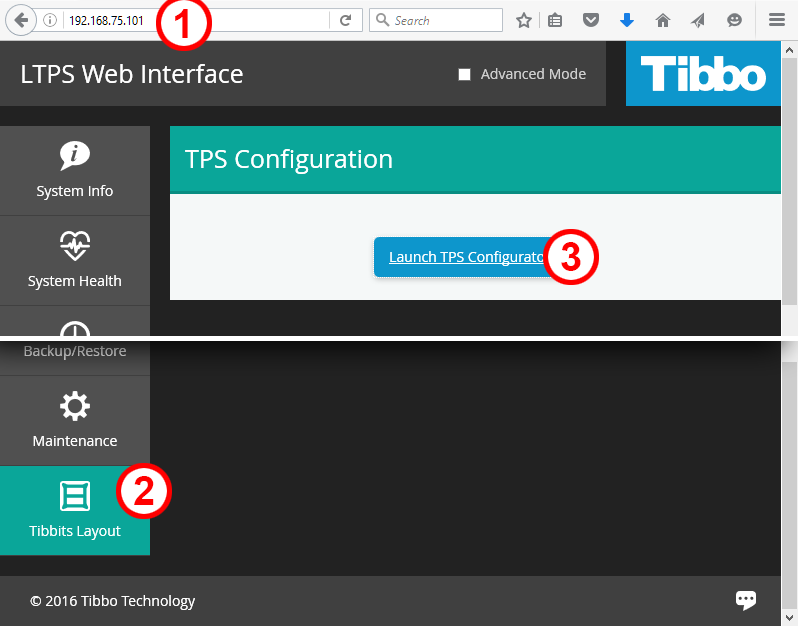
- Open LTPS Web Interface by simply entering its IP address in your browser, select the “Tibbits Layout” tab, and push the “Launch TPS Configurator…” button.
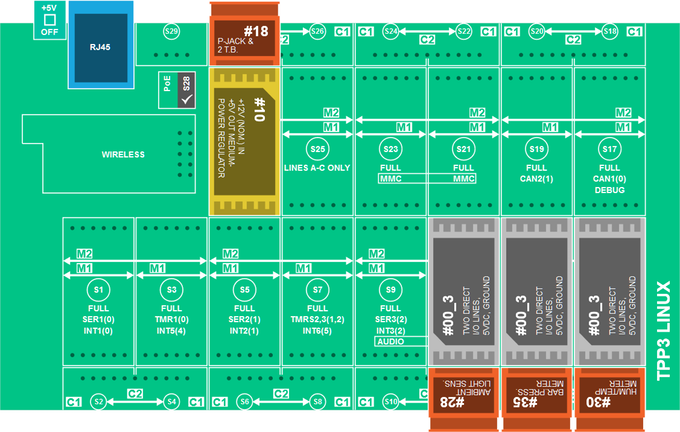
- Setup Tibbits Layout as shown on the screenshot below and click File/Save
Note: TPS needs to be rebooted to take new Tibbits Layout into effect.
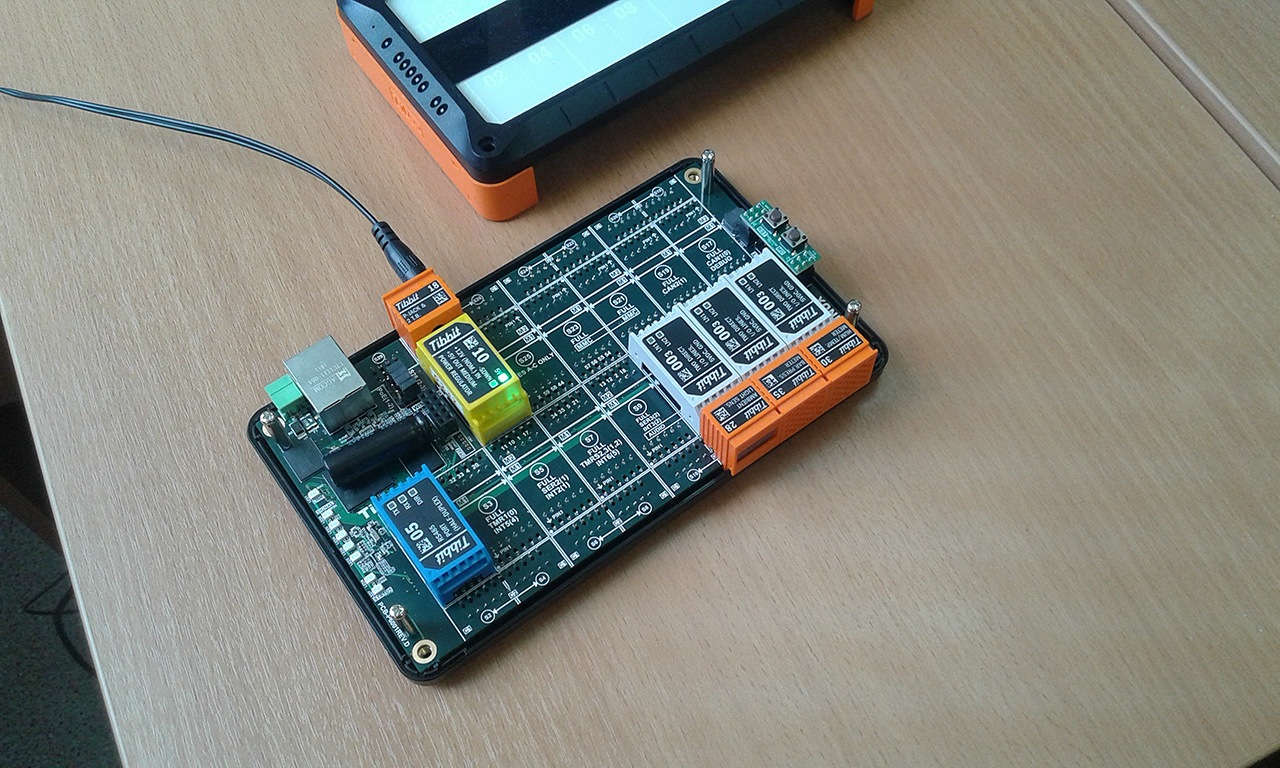
- Assemble TPS according to the Tibbits Layout
Attention: it’s strongly recommended to shut down TPS before placing/removing Tibbits.
Step 1: First application
Node.js, Git and Python 2.7 are installed on each LTPS by default, but NPM is not.
- For installing, connect it to your device with SSH and do the following:
# Setup package repositories
smart channel --add 150a type=rpm-md name="LTPS all" baseurl=http://tibbo.com/downloads/LTPS/packets/all/ -y
smart channel --add 150c type=rpm-md name="LTPS cortexa" baseurl=http://tibbo.com/downloads/LTPS/packets/cortexa8hf_neon/ -y
smart update
# Install NPM
smart install nodejs-npm -y
then
# Create folder for application
cd /opt/node-apps/
mkdir environment
cd environment
# Install required modules
npm install @tibbo-tps/tibbit-28
npm install @tibbo-tps/tibbit-30
npm install @tibbo-tps/tibbit-35
/opt/node-apps/ folder is proposed to be used for your Node.JS apps.
- In any IDE or even a text editor create azure-app-0.js file with your application:
var tibbit28 = require("@tibbo-tps/tibbit-28").init("S11");
var tibbit35 = require("@tibbo-tps/tibbit-35").init("S13");
var tibbit30 = require("@tibbo-tps/tibbit-30").init("S15");
setInterval(function(){
  var illuminationData = tibbit28.getData();
  var humidityData = tibbit30.getData();
  var pressureData = tibbit35.getData();
  var dateTime = new Date();
  console.log("Date/Time: "+dateTime);
  console.log("Illumination: "+illuminationData.illumination);
  console.log("Humidity: "+humidityData.humidity);
  console.log("Temperature: "+humidityData.temperature);
  console.log("Pressure: "+pressureData.pressure);
},1000);
- Upload it to /environment folder and run:
$ node azure-app-0.js
Date/Time: Tue Jul 19 2016 13:50:54 GMT+0000 (UTC)
Illumination: 115
Humidity: 43.755340576171875
Temperature: 28.05670928955078
Pressure: 738.7398681640625
Step 2: Setting Up Microsoft Azure IoT Hub
Microsoft Azure IoT Hub is a service that allows bi-directional communications between your devices and a solution back end. To complete this part of the tutorial you’ll need:
- TPS device(s) prepared as shown on the Step 0
- An active Azure account
- A PC with installed Node.js
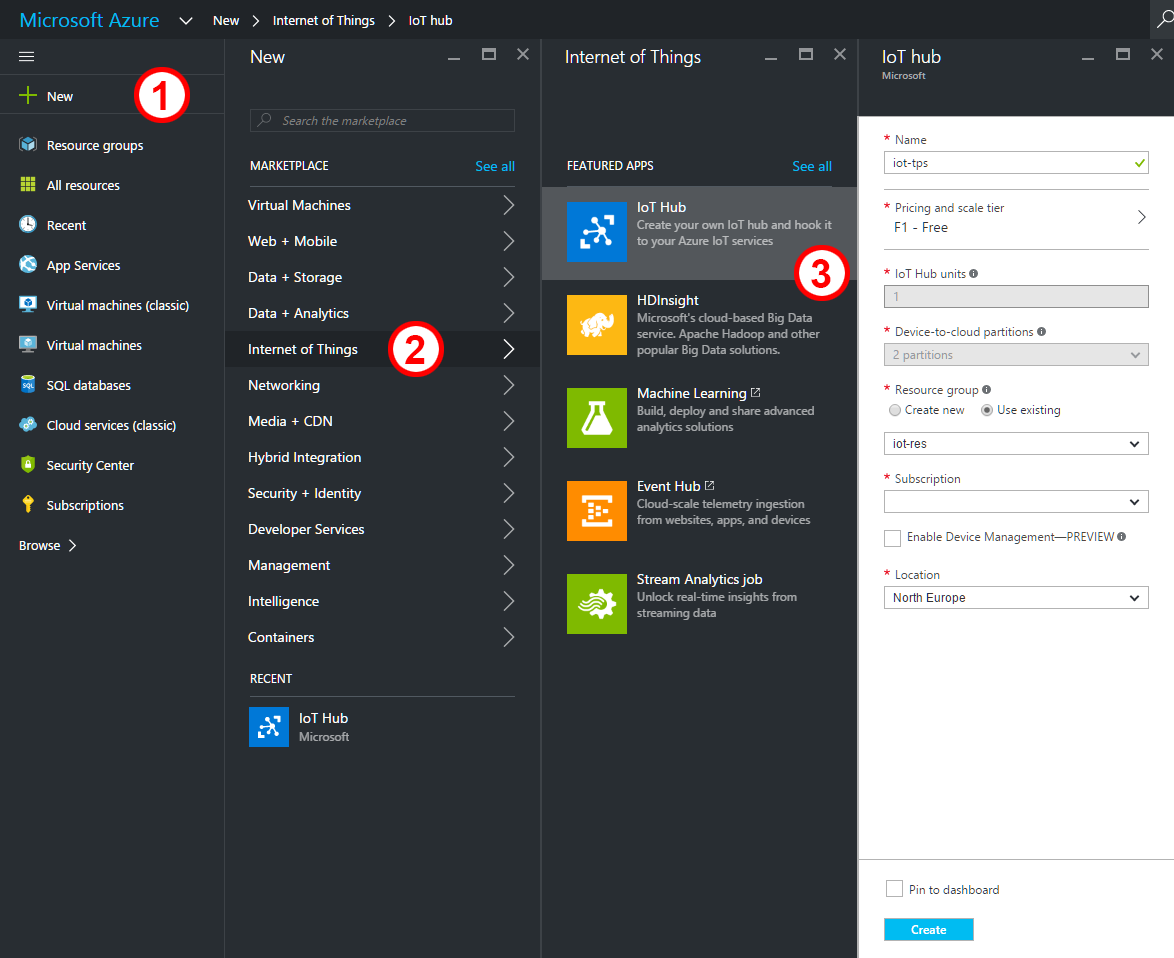
Create an IoT Hub
- Sign in to the Azure Portal
- Choose New > Internet of Things > Azure IoT Hub
- Configure your IoT Hub, then click “Create”
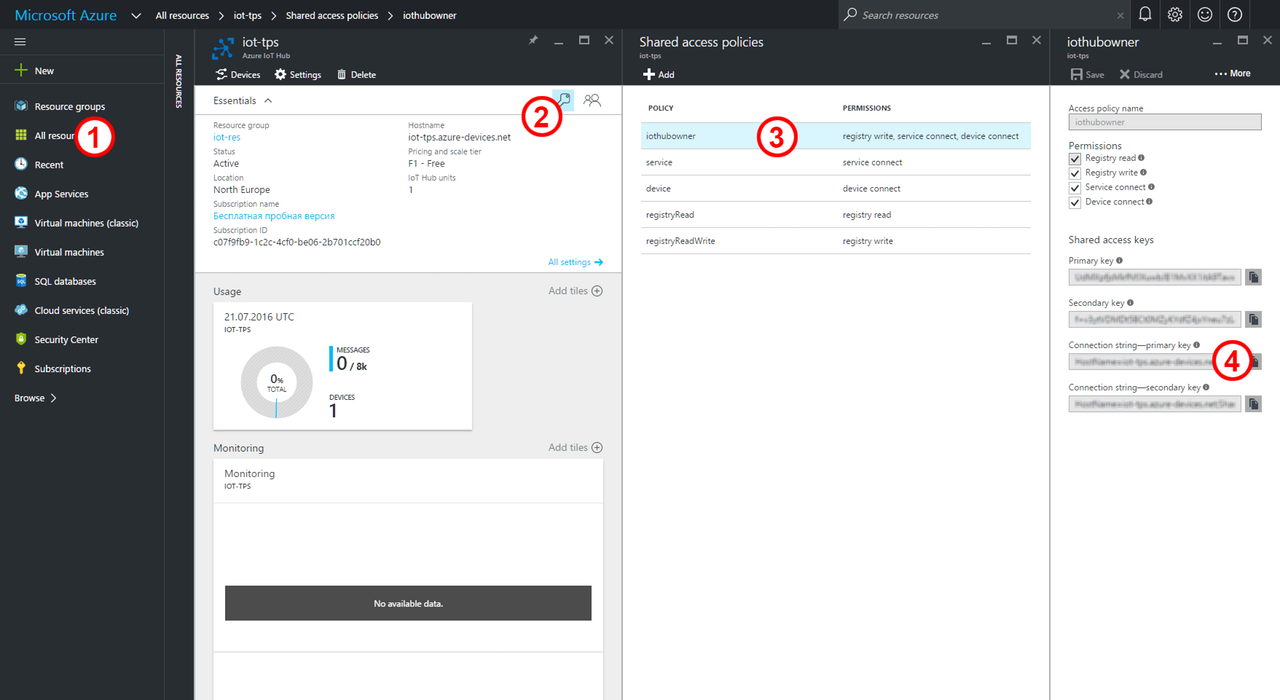
- Wait a few minutes until your IoT Hub has been created then select All Resources > [name of your IoT hub] and click “Keys” icon.
- In the Shared access policies blade select the “iothubowner” item and then copy the value of “Connection string” field.
Step 3: Registering Device Identities
There are three ways to register device identities: with a script using Azure API, with GUI App (for Windows only) and with multiplatform CLI tool. The third way seems to be the most convenient one.
Note: To use iothub-explorer you need Node.js version 4.x or later installed
- On your PC run:
- then:
where <connection-string> is an iothubowner connection string from Step 2.
- To register a new device and get its connection string:
Where <device-name> is e.g. “tps-centreville”.
- Make note of the connections string.
Step 4: Making devices IoT-enabled
- Connect with SSH to the TPS, change folder to /environment and do:
- Create azure-app-1.js file with the following app:
- Upload it to /opt/node-apps/environment folder on the TPS and run:
StartFragment
Event monitoring is the most remarkable and very useful feature for the purpose of debugging iothub-explorer. With iot-explorer, you can easily observe events sent by your devices to cloud and vice versa.
Note: this command requires providing iothubowner connection string even if you’re already logged in.
- On your PC do:
You can see every event as soon as it’s sent to IoT hub.
Step 5: Configure Stream Analytics
Note: To compelete this part of the tutorial you’ll need an active Microsoft Power BI subscription.
Before the information can be delivered to Power BI, it must be processed by a Azure Stream Analytics job.
- Choose New > Internet of Things > Stream Analytics Job
- Configure the Job, then click “Create”
- Wait a couple of minutes until the Job has been created, then select All resources > name of your Stream Analytics Job
- Click Inputs > Add
Set up input in the following way:
- Input alias : data-from-tps
- Source Type : Data stream
- Source : IoT Hub
- Subsriptiopn : Use IoT hub from current subscription
- Endpoint : Messaging
- Shared access policy name : iothubowner
- Consumer group : powerbi
- Click “Create”
For more detail: Environmental Monitoring with TPS, Azure, and PowerBI