The idea of the project was to create a useful and commercial product for winter sport enthusiasts. We both love skiing so we wanted a product that could provide us with information and a way to visualize our skiing behaviors. The initial idea that we wanted to create was a skiing HUD with responsive voice feedback. We quickly realized that this project would not be reasonable with the time constraints that we had. However the motivation behind the project remained the same. We therefore decided on the idea of a data logging device that could be paired with a MicroSD card and a python script to visualize and track progress of skiing runs throughout your day.
Overview
The motivation behind this project is that it involves skiing, an activity that we both love doing. In addition, sport technology is becoming increasingly popular with commercial products such as the GoPro and certain other extreme ‘smart’ sport optics, helmets, and FitBits that give the user added abilities and pertinent information. The rise of this type of technology is due to two factors. The first is an increase in the amount of information that we share on social media. Having the ability to track and share where you ran, your latest scuba diving experience, or your ski run down Corbet’s Coulier in Jackson Hole gives the user something to tell his friends about and actually show them what it was like. This gives the user positive reinforcement and motivation to keep doing the things he or she loves. The second factor is for safety and convenience. Many of these activities such as riding a motorcycle, skiing a double black diamond, or diving 100 meters underwater involve many risks that if solely under the user’s control would impede the ability to perform and have fun. In an effort to make such activities safer, the point is to provide the user or athlete with as much real time information as possible to allow them to make the smartest decisions possible in the shortest amount of time. As we shifted toward a focus on a data logger rather than an actual HUD, we shifted our focus to providing feedback that can be stored on a MicroSD card to the user rather than using real time data.
The device recieves data from an accelerometer, a gyroscope, and a temperature and pressure sensor in order to create a snapshot view of a user’s local acceleration, velocity, temperature, and altitude. This data is then logged to a MicroSD card where the user can run a python script on the csv file saved in the MicroSD directory in order to create data that can be plotted using Microsoft Excel or MATLAB. The data received from the accelerometer is in an analog voltage format for x,y, and z directions. The data received from the pressure sensor includes temperature in degrees Celsius, pressure in Pascals, and altitude in meters. The data received from the gyroscope includes x,y, and z axis rotation rates in degrees per second.
In order to generate a useful output for the user to analyze, the data that we log from the accelerometer and gyroscope need to be corrected to compensate for gravity.
Accelerometer & Gyroscope Theory – Compensating for Gravity
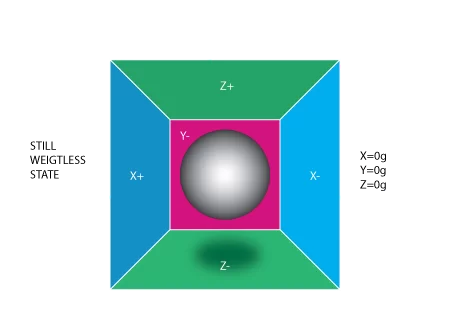
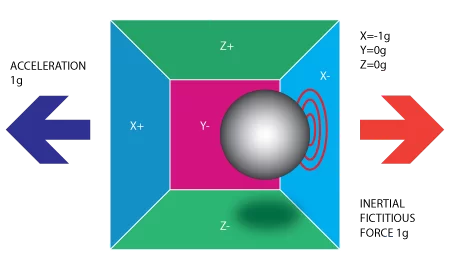
Accelerometer’s can be visualized as a ball inside a cube. With no gravitation fields or any force on the ball, the ball would simply float in the middle of the box as shown below. This is the case if for example, the box were far in outer-space. If we suddenly move the box to the left with an acceleration equal to 1g, the ball will hit the wall “X-“. The pressure force that the ball exerts on the wall is measured and output as a value on the positive X-axis.
If we know consider the accelerometer as being on the Earth’s surface. Now, the force of gravity is pulling down on all objects at a constant 1g=9.8m/s^2. In this case, the gravitation force pulls the ball down inside the cube so that it hits the -Z wall. This would produce a -1g reading on the Z-axis. Up to this point, we have simply considered one dimensional problems along one axis at a time, however that is not the case when the accelerometer and the device is in motion. Now, the force can be spread out over two walls or axes or even possibly 3 axes. If we rotate the box that we’ve been using, 45 degrees to the right, the force of gravity now has components along both the -Z and -X axes. The angle of rotation determines the components along each axes as the cosine of the angle. Now the problem has essentially become a question of the projections onto the 3- orthogonal X,Y, and Z axes of the gravitational force vector. If we are able to know the angle, then we can compensate for gravity.