Introduction
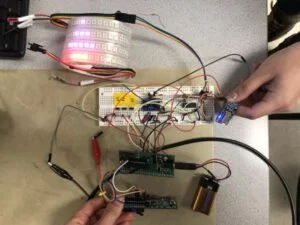
We developed a wearable hydration monitoring system that will track an individual’s hydration levels by measuring the bioimpedance of the skin, that will transmit the data via Bluetooth to his or her cellphone, and that will provide a visual cue corresponding to their hydration.
Our completed project!
High Level Design
Rationale
Dehydration is usually associated with exercise or warmer temperatures, yet the Institute of Medicine reports that up to 75% of the population are functioning in a state of chronic dehydration. Experts recommend drinking between eight to ten cups of water per day, yet many drink far less than this amount. Dehydration can result in fatigue, hunger, nausea, dizziness, irritability, and a loss of concentration or short-term memory. It can also result in long-term medical conditions such as kidney stones. Yet dehydration, unlike other medical conditions, usually has imperceptible symptoms until the condition becomes severe. Many people are unable to identify when they are dehydrated. This project’s aim is to combat chronic dehydration.
Background
There are several different methods to detect hydration in the human body. One method is the detection of changes in mechanical properties of the skin. For example, the “pinch test” is a commonly-used skin elasticity test to quickly determine if a person is dehydrated. However, it is difficult to calculate a threshold at which the person can be immediately determined to be dehydrated or not. Another method is light-based detection. Non-invasive light patterns cast through the skin with a laser can measure changes in blood glucose that happen with decreasing water volume. However, this does not easily work with the noise of other analytes in the blood stream such as sodium or iron. For our hydration sensor, we plan to measure hydration using skin impedance. The skin has capacitive as well as resistive qualities. Based on the impedance measured from attaching electrodes to the skin, one can extract information about the composition of the skin, including water content.
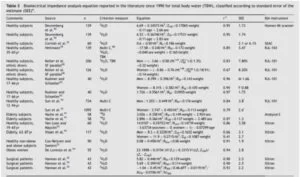
Once the bioimpedance of the skin is acquired, one can derive total body water (TBW) content using additional parameters such as sex, height, weight, and age. Many validated models exist that use the impedance at 50 kHz to calculate TBW, which influenced our decision to measure the average impedance at 50 kHz as an indicator of hydration. Beyond TBW, fat-free mass and body mass index may also be derived from bioimpedance measurements. While we did not explicitly use any of the below equations or the research material documented in our references, we found that examining these was important for determining the feasibility and potential directions or applications of our project.
Design Tradeoffs
Both hardware and software equally contributed to the success of the project. We had initially considered the possibility of building a simple current meter using a constant current output DAC and driving a variable sine wave at hardcoded frequencies using DMA. This possible alternative to the AD5933 impedance analyzer would have been a simple hardware setup consisting of an inverting op-amp but would have relied heavily on us developing our own software to have the PIC produce the desired impedance meter. Instead, we opted for the more expensive AD5933 impedance analyzer as our main hardware component to our hardware since it had been verified by many prior projects. The software trade-off for this design decision was that we setup I2C communication in the software, but that the frequency sweep could be easily modified and the output signal easily interpreted. We originally planned to use the Digi-Key HM-11 RF transceiver, but opted for the Adafruit Bluefruit LE UART Friend since it was easy to use from both a hardware and software perspective and came with an associated app that reduced the peripheral software work for the project. For our light strip display, we opted for Adafruit Dotstar over Neopixel since it was heavily documented and simpler to implement a decrementing hue.
Standards
The Bluetooth standard (IEEE 802.15.1) is commonly used with devices that involve bluetooth transmission of data. This standard states that Bluetooth should be used in a range of 100m with 1-3 Mbps data transmission, a bandwidth of 2.14 GHz, a power consumption from 2.5 to 100 mW and uses that include short range control and/or monitoring [2]. IEC 60601 standard is focused on safety with designing medical equipment especially concerning electrical safety.
Existing Devices
There exists a significant amount of relevant background resesarch for bioimpedance devices. However, none of the materials we researched were patented or had proprietary statutes. Previous designs of hydration sensors have been patented but are focused on designs based on light detection and fluid flow. While there are a few that utilize change in impedance as a method of detection, to our knowledge no patent incorporates impedance detection with the other components of our device including bluetooth connection, LED feedback, different modes, and wearability.
Hardware Design and Testing
To accomplish this much larger project, we decided the best approach was to tackle smaller project individually and combine them at the end. The main enabling components, which will be further expanded upon, are as follows:
- RGB LED (SPI)
- Bluetooth Module (UART)
- Impedance Analyzer (I2C)
These components were all connected in some way to the PIC32MX250F128B microcontroller mounted on Sean Carroll’s small board design. We switched from the big board with the TFT to the small board once debugging was accomplished. The small board is more compact, which would be our ultimate goal in a wearable design. In addition, we used push buttons with 300 Ohm pull-up resistors to allow for ease of demoing all functionalities. Lastly, we used three-prong adhesive skin electrodes and connected two prongs to the impedance analyzer to create a closed circuit. These electrodes were useful since they allowed us to measure impedance at a fixed distance. Presumably increasing the distance between the electrodes would increase the impedance because the additional skin would act like a series resistor. It was necessary to apply a conducting gel to the electrodes before attaching to the skin so as to prevent high impedances due to the air-skin interface.
RGB LED (SPI)
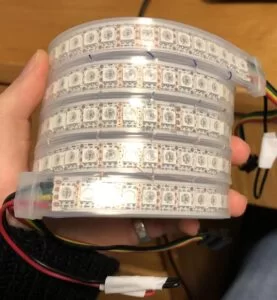
The RGB LED is hardware whose main functionality is providing subtle user feedback through colors that scale to a user’s level of hydration. We used an 144 pixel Adafruit RGB LED Dotstar light strip and sewed it together to form a bracelet whose circumference is 33 pixels. The light strip required a steady 5V power supply and communicated with the PIC microcontroller by SPI. Since the PIC microcontroller operates at 3.3V, we needed to use a 74LS125AN voltage level translator to convert the output from pins RB5 (SDO2) and RB15 (SCLK2) to a 5V scale. We tried using a voltage regulator to reduce the 9V battery power supply from Vin to 5V to completely battery power our circuit, but the Dotstar strip draws a lot of current and would quickly reduce the battery power. It also did not demonstrate normal activity once the voltage on the battery began to drop.
Bluetooth Module (UART)
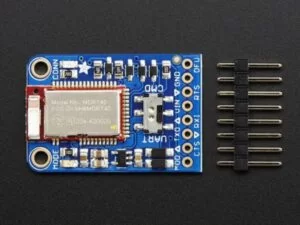
We tested several Bluetooth modules before deciding on the Adafruit Bluefruit LE UART Friend unmounted. The module communicates with the PIC32 via UART. The TX (transmit) and RX (receive) pins of the board are connected to RXI and TXO pins of the module. The Bluefruit module can communicate at levels of 3.3V-16V but is regulated down to 3.3V. The power pin of the Bluetooth module is connected to the same 5V power supply as the Dotstar strip, and the ground pin of the module is connected to the PIC32’s ground to create a full circuit.
The CTS (Clear to Send hardware flow control) pin informs the Bluefruit that it can send data back to the microcontroller over the TXO pin. This pin is pulled high by default and must be set to ground in order to enable data transfer out. Because the device constantly transmits data, the CTS pin was tied to ground.
Impedance Analyzer (I2C)
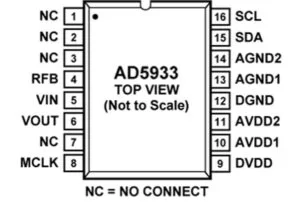
The impedance analyzer is one of the most critical parts of our project. It communicates with the PIC32 through I2C. The SDA and SCL lines of the PIC32 are connected with the SDA and SCL lines of the impedance analyzer.
A significant breakthrough in using the AD5933 analyzer was the realization that a voltage excitation range of 2 Vpp reduced the SNR (signal to noise ratio) and the resolution of the resistances that could be used. Without an analog front end, a voltage excitation range of 2 Vpp can measure impedances in which the maximum impedance is forty times larger than the minimum impedance, but a voltage excitation range of 2 mVpp can only measure impedances in which the maximum impedance is only twice as large as the minimum impedance. There were concerns as to the amount of current that was being passed through at an excitation range of 2 Vpp, but we were able to assuage these safety concerns by confirming the max current with an ampmeter and isolating the circuit from an outlet power source that could surge by instead using a 9V battery supply to the microcontroller. The change in voltage excitation range resulted in using a different value for the feedback resistor. A smaller voltage excitation range means that the output signal will more easily saturate. In testing the AD5933 Impedance Analyzer, we found that saturation rendered data retrieved by the PIC32 completely useless. It could not tell the difference between 1K or 10K resistors. Once we switched back to the 2 Vpp range, we followed the datasheet’s recommendations for choosing the feedback resistor value Rfb to match the expected median impedance of the tested sample. Yao et al. [1] found that the skin impedance ranged from 1k-5kOhm, so we chose an Rfb value in this range. As saturation continued, we lowered the value until settling upon 471 Ohms. This agreed with our skin impedance measurements which ranged from 300-700Ohms. Surprised by the discrepancy, we confirmed the impedance analyzer’s functionality with known resistor values in the 1k-5kOhm range and the results were fairly accurate.
Program Design and Testing
The program can be decomposed into threads, which are a sequence of programmed instructions that can be managed independently by a scheduler. To best discuss the program, it is easiest to do so following the program’s thread structure. Much of the code was programmed with the help of sample code found on the course website. The discussion of each thread will cite the reference code that the thread’s program was developed from. Commented code can be found here.
- RGB LED Thread
- Bluetooth Module Thread
- Impedance Analyzer Thread
- Timer Thread
- Main Thread
RGB LED Thread
The dotstar thread uses the average impedance value measured from the impedance analyzer and scales it to a hue value between 0 and 245 (red to blue). This corresponded to an impedance range from 300 to 700 based on tested impedance values at 50 kHz. In addition, the lighted teardrop appears to decrement as the impedance drops by quarters. This effect is achieved by setting top rows to the lowest intensity and reducing the saturation by 20%. The thread loops through the LED strip and uses the written rowNum() method to determine which row of the bracelet the LED lies in based on index position. Using case-switch logic, the HSV variables are set for each individual pixel. The LED array is then written to the Dotstar strip through SPI communication using the write_pixels() method. If the scaled hue value is less than 0, the teardrop will start flashing by alternating the pixel intensity with zero. Upon moving to the small board without the TFT LCD screen, we used visual features of the Dotstar strip for debugging. While the impedance analyzer is performing a sweep, a light comes on near the teardrop design. The color of this light will also indicate what mode the device is in with different associated hue values (green for mode 1, pink for mode 2).
We used general set and write functions developed for Dotstar from the course webpage on pixel display strips.
Timer Thread
This thread regulates the start and re-starting of impedance sweeps by resetting the flags. It does this for three different modes including calculating the average across ten impedance measurements for mode 1. If the device is in mode 1, impedance sweeps from 30kHz to 80kHz is conducted ten times with five seconds between each sweep and then the magnitude of the impedance at 50kHz ( a commonly used frequency for hydration equations) is averaged across all ten sweeps. The averaging of the magnitude impedance allows for a more reliable impedance. After conducting ten sweeps the timer thread allows for a thirty second wait time before another cycle of ten sweeps is taken.If the device is in mode 2, the timer thread allows it to run but changes the mode back to mode 1 after one run. For mode three no impedance sweep flags are set because no sweep is conducted.
The yield time between sweeps was chosen arbitrarily. Ideally, for a low-power wearable device we would power down the impedance analyzer while it was not in use and only sample every few minutes since hydration changes rather slowly. For demo and debugging purposes, it was better to use a short wait time to take measurements faster. The wait time allowed us time to transfer electrodes while testing.
Bluetooth Module Thread
Initial testing was done with serial console. Putty was initially used. During testing of different modules, we decided to switch to SSDCOM32, a different serial console because there were concerns about Putty transmitting characters one at a time when the full set of characters needed to be sent. We used a UART USB wire to send test data to the Bluetooth module.
There are additional configurations to enable UART as well. Serial communications must be enabled in the project’s configuration header. A baudrate of 9600 8N1 also must be specified. We used the default TX and RX pins on the board, so there was no need to reconfigure the lines.
Another factor favoring the Bluefruit module is its easy integration with mobile phones. Adafruit has already created a mobile phone application for the Bluefruit module. Two methods of display utilized with this app include the UART basic terminal, which solely displayed the sent values and/or characters, or the Plotter which displayed impedance values in a line plot. The Plotter tool was useful to view changes in impedance over time. However, we were unable to find a way to change the x axis on the Plotter. It would have been helpful for Mode 2 to create Bode plots in the frequency domain.
There were clear visual cues for connection and disconnection between the Bluefruit module and mobile devices. The Bluefruit blinks red when disconnected and lights up blue when it is connected. Each time the program executes the thread, information is transmitted from the Bluefruit module to the phone.
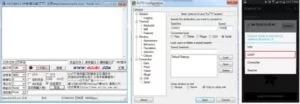
The course’s webpage on UART helped us greatly. We used the website’s sample code and the module’s data sheet
The bluetooth module was set to data mode where a constant stream of data is being sent over UART. If in mode 1 the average magnitude impedance is sent and if mode 2 then both the magnitude and phase are sent over bluetooth using the PT_send_buffer and PT_DMA_output. This UART communication was modeled after code found on the ECE 4760 website.
Impedance Analyzer Thread
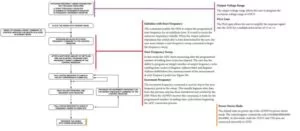
The impedance analyzer thread coordinates the impedance sweep process shown in the flow diagram below if mode is 1 or 2 (mode 3 requires no sweep). The least significant bits of the Control_high register (0x80) are OR’ed with the required control commands to start the sweep. The Status register (0x0F) is polled until it indicates that an impedance measurement for the frequency has been completed. The impedance measurement (two chars) is then stored in integer variables for both the real and imaginary value. The Status register is again polled to determine if the sweep has finished. If it hasn’t then an increment command is issued to the Control_high register. This process is repeated until the sweep has been completed. The phase is taken with the arctan of imaginary over the real value. The magnitude is calculated by taking the square root of the sum of the square of the imaginary and the square of the real values. Since the square values of the imaginary and real components were large, it was necessary to cast them as floats. To get the final magnitude of the impedance the gain factor has to be multiplied by the inverse of the resultant magnitude. This calculation is expanded on in the next section.
A gain factor was hardcoded into the program to calculate the nominal impedance. The raw magnitude calculated from the imaginary and real values generated by the impedance analyzer does not correspond to the actual impedance magnitude. To get the actual impedance magnitude a gain factor needs to be multiplied by the inverse of the raw magnitude as shown below. To determine the gain factor, various resistors were tested with the impedance analyzer. A resistor’s impedance should equate to it’s resistance so this was a simple method for calibration. The gain factor was found as shown below (taken from the data sheet). And then multiplied to the raw magnitude before transmitting the value through bluetooth. There is a chance that the gain factor varies over different frequencies. This was addressed by calibrating the gain factor using one frequency (50kHz) also used in the typical hydration measurement.
I2C helper library from another group’s project from 2017. The course’s webpage on I2C helped us greatly as well.
Main Thread
The main thread schedules each of the above threads as well as configuring the settings so that the program can communicate with each of the peripheral sensors. It manages logic for executing device functionality depending on what mode the device is configured to.
This device includes three modes of operation and three corresponding push-buttons to allow user control over device mode. Mode 1 runs the typical impedance sweep from which hydration data is collected. This impedance sweep runs from 30kHz to 80kHz in 10kHz steps, though only the 50kHz impedance values are used to determine hydration. Mode 2 runs a long impedance sweep intended for demo purposes and to produce a Bode plot. This sweep runs from 10kHz to ~100kHz in 17 steps (the hexadecimal conversion of 5 kHz frequency increments is not exact). The AD5933 has a maximum working frequency of 100kHz. Mode 3 is for demo of the dotstar and includes no frequency sweep. In this mode, the dotstar teardrop lights decrement over the range of a healthy hydration display to a dehydrated display. Modes are determined by push-buttons which are read in the readButton() function. Debouncing was not necessary, since it only matters if the button was pushed not how many times it was pushed. We included logic to prevent the system from switching modes mid-sweep.
Results
As discussed in the program implementation, mode 1 and mode 2 produce different frequencies. Mode 1 sweeps 10 times from 30kHz to 80kHz and we use the 50kHz value each time. Mode 2 sweeps from 10kHz to 100kHz as shown below.
Mode 3 demos the light strip cycling through the spectrum of colors that correspond to dehydration levels. Deep blue means that the user is very hydrated while flashing red means that the user is very dehydrated.
We tested our impedance analyzers against resistor values ranging from 1K to 5K because our research literature informed us that this was the range skin impedance is usually in. We found that they were accurate within 0.4%. Resistor values rarely strayed beyond 2Ω of the first measurement. The average captures the general trend of the trials very accurately as it overlaps with the first several measurements of each of the trials. There was a tendency for the impedance analyzer to have larger errors in larger magnitude resistors. However, this this was expected since the same percent error of larger values results in a larger deviation from the nominal value.
We also used paper towels and saline solution to mock skin-like material in testing the device. A dry paper towel had a high impedance measured at 55KΩ. A wet paper towel soaked in saline solution had a low impedance at 354Ω. The impedance of the saline-soaked paper towel is within range of experimental skin impedance. This was thus a good basic model for testing impedance and it offered definitive proof that the presence of water (additional water in the case of hydration and skin) would have an effect on impedance.
We also performed a test with lotion. The results were for the most part as expected. The bioimpedance graph with the plotted resistances has a curve similar to exponentially decaying functions. In the first several minutes, the lotion has a significant effect on skin, hydrating the top layers of the dermis. The bioimpedance is measured at a lower impedance because the skin is more hydrated and has more water content. However, the lotion takes time to penetrate into the deeper layers of the skin and thus does not hydrate enough. The graph shows that after the first ten minutes, the hydrating effects of lotion have less impact. the bioimpedance is still decreasing but at a slower rate than before. However, we were surprised by how low our bioimpedances were. Each of us measured below 1KΩ even at partial dehydration, but research literature corresponded these values with being extremely hydrated.
We attempted to assess the efficacy of hydration by fluid intake. Person 1 drank 750mL of water and person 2 drank 355mL of apple juice. However, we found that results lacked meaning. For example, measurements taken immediately after drinking water had lower impedances than measurements taken twenty minutes later. This was confusing as it meant that the skin was more hydrated immediately after drinking water. Measurements were taken about every five minutes and values alternated between being greater than or lesser than the first measurement. Results were inconclusive, and we realized that drinking water as a test for hydration was not tenable.
Conclusion
Our hydration wearable is successful and has achieved all goals and expectations that our group had in mind. All functionalities have been implemented in a timely manner for the final project time period. Our device is a good representation of skills learned throughout the semester as we use all three major modes of communication with the microcontroller (I2C, SPI, UART).
Our results demonstrate that the bioimpedance of the skin is on the order of 400 Ohms. In our testing, we did not see extensive deviation of the skin’s bioimpedance, leaving us to make an educated guess of what the full scale range of impedances is. Regardless, these findings do not support the skin impedance range cited in Yao et al. [1]. This may be due to their unique printed silver nanowire electrode design.
By performing a large frequency sweep, we were able to observe the frequency-dependent impedance properties of the skin. By creating Bode plots of phase and magnitude, we could further investigate the simplified RC circuit of the skin and determine resistance and capacitor values. Expanding upon the framework that we have created for this, could be a major benefit to skin tissue research. Although we envisioned developing a device for commercial use, this device may have additional applications. Bioimpedance may be an alternative modality to imaging to quantify tissue composition and regularity. For example, orthopaedic surgeons could use an impedance analyzer to measure cartilage tissue health during surgery. Also, with capabilities of measuring impedance components, this device may be used in electronics to evaluate and generate a simplified circuit.
Future steps of this project would involve scaling down the circuitry in size so that it could all compactly fit in a wearable bracelet. We also need to perform more thorough calibration tests.
Intellectual Property Concerns
All outside sources or influences on our project have been appropriately cited in the appendix. The structure of our code and some of our circuitry is based upon previous that can be found on the ECE 4760 course website. Our project also leverages the PIC32 Standard Peripheral Library and the Protothreads library.
We have found no projects in which our project infringes on patents or copyrights. We do not intend to patent our project. No proprietary music, images, words will be incorporated into our device so we do not there are very few intellectual property concerns beyond the code we have used from the ECE 4760 website which has already been cited in our references.
IEEE Code of Ethics
Throughout our work on the project, the group has made every effort to ensure that our project is compliant with the IEEE Code of Ethics and is safe in both design and in practice. We have tried our best to minimize the dangers to users (mentioned in our safety conserations) by not allowing those with implanted electrical devices to use our wearable. To the best of our knowledge, our project prioritizes “safety, health, and welfare of the public.” Our project has no immediate impact on the environment or safety and health of users beyond what was discussed in our safety consderations. The project and team members did not present any acts of physical injury or discrimination. Members had no conflict of interest and did not accept any form of bribery. All data and findings in this report are truthful. None of the written report has been fabricated. Additionally, all outside sources or influences on our project have been appropriately cited in the appendix.
Overall, our device adheres to IEEE Policies, 7.8 Code of Ethics. At any point in the future, if a violation of the ethics code or any harmful effects of our project are brought to our attention, we we will address the issue swiftly and properly.
Safety Considerations
General risk is minimized since the circuit is powered by a battery source instead of an outlet, thus limiting the risk of shock. Additionally, the current is not passed over the heart, both electrodes are placed in close proximity on the same wrist. That being said, electrodes will be attached to skin to measure its bio-impedance. As such, those with pacemakers or ICD’s (Implantable Cardioverter Defibrillators) may be at risk when using the hydration wearable because the project sends small amounts of electricity into the body. Some individuals have shown mild skin irritation to the adhesive of the electrode patches.
Legal Considerations
To the best of our knowledge, our project complies with the FDA rules and the Code of Federal Regulations Title 21, Part 50 pertaining to the PROTECTION OF HUMAN SUBJECTS relating to Medical Devices and clinical investigations. We have published data and information about the device on this website so that users may be more infomred about what the device does. We have tried our best to minimize risk and we believe that “the probability and magnitude of harm or discomfort anticipated in the research are not greater in and of themselves than those ordinarily encountered in daily life or during the performance of routine physical or psychological examinations or tests” as specified by the FDA. We shall seek such consent only under circumstances that provide the prospective subject or the representative sufficient opportunity to consider whether or not to participate and that minimize the possibility of coercion or undue influence. After obtaining a user’s informed consent, we attempt to mitigate any forseeable risk or discomfort of the subject. As discussed prior, those with implanted medical devices will be warned of the consequences of using the hydration wearable. Participation is completely voluntary, and any users who will use this device will provide informed consent based on FDA standards as cited in Section 50.25 of the CFR. Our design and implementation of this project was in accordance with sound ethical principles.
Source: Bluetooth Hydration Wearable

