Summary of Breathe-Easy EEG
Summary (under 100 words): This project builds a battery-powered EEG system that measures forehead brain activity, amplifies and filters alpha/beta bands, digitizes signals with a PIC32, computes a fixed-point FFT, displays waveforms on a TFT, and drives red/yellow/green LEDs as neurofeedback. Hardware includes instrumentation and op-amp gain/filter stages, a dual-rail battery virtual ground, and ADC voltage shifting. Software acquires 512-sample windows at 333.3 Hz, runs a 16:16 fixed-point FFT, computes calm/excited bin ratios, and sets LED color thresholds. Safety and IEEE standards for EEG bands and isolation were followed.
Parts used in the Breathe-Easy EEG:
- Adhesive electrodes (2 forehead, 1 arm virtual ground)
- Jumper cables (twisted pair recommended)
- Six AA batteries (9 V battery pack)
- 2200 µF capacitor
- LM358 op-amps (multiple for filters, virtual ground)
- INA121 instrumentation amplifier
- Resistors and capacitors for gain and 2nd order HPF/LPF (examples: 1k, 100k, 20kΩ, 5kΩ, 10kΩ; 1 µF)
- Voltage divider components for ADC level shifting
- PIC32 microcontroller (ADC input pin 24)
- TFT display (for oscilloscope and FFT display)
- Red, yellow, and green LEDs
- Function generator (used for test circuit)
- Misc protoboards/whiteboards, wiring, and connectors
- Laptop (USB-powered, unplugged from AC) for PIC32 power and interface
Introduction
By measuring brain activity using electrodes and an amplifier circuit, electroencephalograms (EEGs) are at the intersection of electrical engineering and neuroscience. By using signal processing techniques, we can examine the effects of external stimulation, such as music and meditation, on brain waves. We primarily examined alpha and beta brain waves in our EEG. While alpha brainwaves are linked to meditation and relaxation, beta brainwaves are connected to being awake and using our brain for reasoning. In order to try and control an external event, in this case turning on a specific coloured LED based on our alpha and beta brain waves, we can then observe the resulting brain waves on a screen. The neurofeedback from the LEDs offers a way to self-regulate brain waves in this way, which can be helpful in applications like cognitive-behavioral therapy.
High Level Design
Rationale and Source of Our Project Idea
Since both of us were interested in neural feedback systems and projects with biological applications, we decided to work on this project. Charles Moyes and Mengxiang Jiang’s Brain-Computer Interface project from the spring of 2012, in which brain waves were utilised to control an EEG Pong game, served as our inspiration. We were interested in using our brain waves to visualise our mental state and in determining whether the biomedical applications of electrical and computer engineering could help us understand how our brains respond to stress and how to relax ourselves through breathing exercises. This project’s combination of analogue circuit design, signal processing, and software design made it technically intriguing to us as well.
Background Math
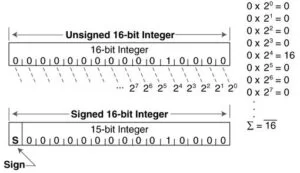
Understanding Fast Fourier Transforms (FFTs) and fixed point arithmetic is essential for this project’s math. Since we can represent these numbers as 32-bit integer types and fixed-point arithmetic is much faster than floating point arithmetic, it is preferred. 16:16 In 16:16 fixed-point representation, the fractional portion of a number is represented by the least significant 16 bits, and the non-fractional portion by the most significant 16 bits. The table below shows the conversion between fixed-point and decimal.
In this EEG project, FFTs are used to comprehend the frequency characteristic of a signal. In this example, it enables us to understand the peak frequency of our brain waves as well as the proportion of alpha waves to beta waves in our brain waves. The following equation represents an FFT.
Logical Structure
The high level block diagram of the EEG system is shown in Figure 1 below. This EEG’s hardware consists of 5 stages with a total gain of 1250. We apply adhesive electrodes to the forehead of a user, and then connect jumper cables to the negative and positive ports of an instrumentation amplifier. We take another electrode measurement from the user’s arm to the circuit ground rail in order to properly ground the circuit. We built a dual-rail battery circuit to obtain +4.5 and -4.5 V rails because all of the amplifiers used in this project are dual-rail and we are unable to use an AC power source. We anticipate a signal of the order of microvolts to millivolts from the electrodes themselves, so a high gain is required. Following two stages of gain, there are two stages of filtering that remove all frequencies above and below 8 Hz, bringing us into the alpha and beta wave ranges. To ensure that the signal is between 0 and 3.3V so that the PIC32’s ADC can read it, our final hardware step uses a voltage divider.
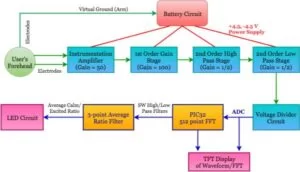
Once the hardware has provided us with 512 ADC samples, we take an FFT of the data and display the wave on the TFT screen at the same time. Using an oscilloscope was not an option because we were unable to connect the circuit to any AC power source for safety reasons. We can determine the ratio of “calm” waves to “excited” waves by finding the FFT spectrum’s peak frequency and adding up a few bins. The result of passing this ratio through a 3-point averaging filter repeatedly is an average ratio that, depending on the user’s state, is used to turn on red, yellow, or green LEDs.
Hardware Software Tradeoffs
This EEG system does not have a lot of hardware-software tradeoffs because it is primarily an analogue project. The filtering out of brain wave frequencies outside the alpha and beta ranges is one that is pertinent, though. In this instance, it was most effective to use both hardware and software filtering. At first, we tried to filter primarily using hardware, but the filter cut-offs weren’t very sharp because the brain waves’ own low amplitude. As a result, occasionally, despite being severely attenuated, frequencies below 6 Hz were still picked up by the ADC. After performing an FFT on the brain waves in this instance, we introduce a software filter and only turn on LEDs using information from frequencies within the alpha and beta wave band.
IEEE Standards
There are IEEE recommended practice for neurofeedback systems which we adhered to. We followed their definitions of EEG activity in terms of frequency bands, which are as follows: DC-EEG: < 0.1 Hz, delta: 0.1 to <4 Hz, theta: 4 to <8 Hz, alpha: 8 to 13 Hz, beta: >13 to 30 Hz, and gamma: >30 Hz (particularly 36 to 44 Hz). It is necessary to document the system in terms of compliance with the IEC 60601-1 Safety and Essential Performance standard in order to meet the regulatory requirements established by IEEE that apply to us. The remaining regulatory requirements do not apply because we do not intend to sell this product. IEEE also sets up system standards, such as thorough documentation of the system’s components, particularly the electrode/sensor, acquisition—which refers to the feedback mechanism, software, and computer and display hardware—as we do on this website. According to IEEE, the electrodes must be biocompatible and their application to the scalp must be repeatable while accounting for individual human variability. Two adhesive electrodes were applied to the user’s forehead, and one was applied to the user’s arm to serve as a virtual ground. If there are any disabilities, this ground can be put in other places.
Hardware Design
The specifics of each element in the high level block diagram will be covered in this section. There are five hardware stages total, and each one includes some form of amplification or filtering. We used an incremental design approach to build the hardware, testing each stage only after confirming that the stage before it functioned as intended. Recommended to always use quality ICs(Integrated Circuits) in your circuit to avoid issues in future.
Battery Circuit
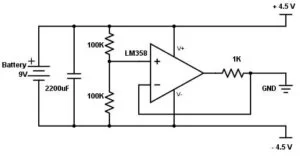
We had to provide a dual rail voltage supply to power the op-amps. A +4.5V and -4.5V power rail was created by us. We built a battery circuit to supply the necessary voltage because we couldn’t connect our circuit to a power source directly. Six AA batteries made up our battery pack, which produced a 9V power source. With the ground of the battery pack connected to the capacitor’s negative side and the other lead to its positive, we connected the battery across the two leads of a 2200 F capacitor. The battery ends were connected to an LM358 op-amp using two 100K resistors. A +4.5V rail was created using the op-VCC amp’s pin, and a -4.5V rail was created using the GND pin. The op-output amp’s is connected to the same virtual ground as the circuit’s other elements, which is covered in more detail later on in this page. Figure 2 below displays the battery circuit’s schematic.
Test Circuit
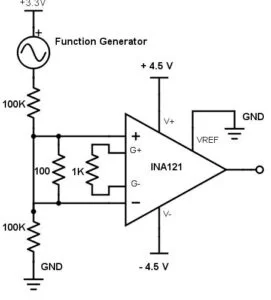
We needed a test circuit to simulate the level of attenuation that we anticipate from a brain wave reading in order to test each stage without attaching electrodes to the user. We constructed the test circuit shown in Figure 3 below to achieve this and connected it to the instrumentation amplifier. The subsequent phases did not change while the hardware was being tested. We fed a voltage divider that simulated a brain wave a 2Vpp sine wave from the function generator. The attenuation factor is determined as follows: R1⁄2*R2. The diagram’s R1 and R2 values of 100 and 100K give us an attenuation factor of.0005. A 2 Vpp signal is reduced to a 1 mV signal, which is within the range of brain waves that we may encounter.
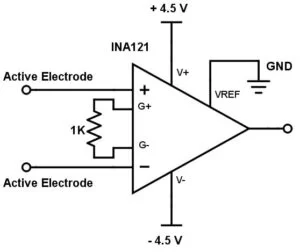
Instrumentation Amplifier and First Order Gain stage
The first few stages of our amplifier circuit are depicted in Figure 4 below we have used IC Chips carefully. The INA121 Instrumentation Amplifier measures the user’s two active electrodes from the forehead and amplifies brain wave signals with a gain of 50 while being powered by the dual-rails from the battery circuit. In order to better eliminate 60 Hz power line noise, we twisted the input cables that were attached to the electrodes together. Since both pairs are now equally exposed to electromagnetic noise, the twisted pair helps to reduce the normal mode noise. An instrumentation amplifier’s extremely low noise and high input impedance make it perfect for measurements. We employ a 1k gain resistor Rg to produce this gain of 50. The formula for the increase of an INA121 amplifier is G = 49.4kΩ⁄Rg + 1.
Our next stage is a 100 gain, first order gain stage. In Figure 5, this is displayed. The formula for an LM358’s gain is G = RgR1. With Rf = 100K and R1 = 1K in the circuit below, we have a gain of 100 for this stage. In order to give the subsequent filtering circuits a sharper cut-off response, we chose to amplify the circuit before filtering out all the noise.
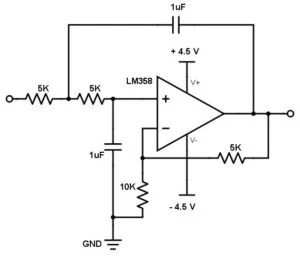
High Pass Filter
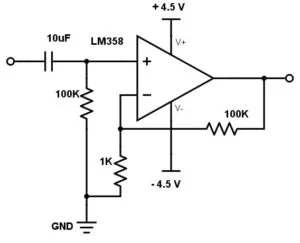
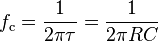
An op-amp called the LM358 was used to build a high pass filter circuit that allowed frequencies above 6 Hz to pass. We decided to set the cut-off in this manner because alpha waves start at 8 Hz and because we wanted to allow for noise and interference. This makes it possible for us to filter out lower frequency waves like theta and delta waves. The equation below is used to calculate a 2nd order filter’s cut-off frequency.
By using resistor and capacitor values of 20KΩ and 1μF, we obtain a cut-off frequency of about 6 Hz. The schematic of the HPF can be in Figure 6. The gain of this stage can be calculated as G = Rf⁄R1. With Rf = 5KΩ and R1 = 10KΩ, the gain for this stage is ½.
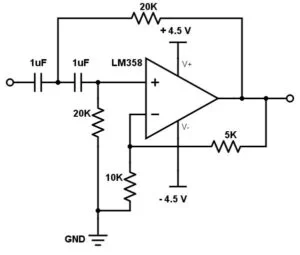
Low Pass Filter and Voltage Divider
As previously mentioned, we made special efforts to reduce the 60 Hz power line noise. However, we needed a Low Pass Filter to restrict our range to alpha and beta waves, so we constructed one with another LM358 op-amp. You can see the schematic for this in Figure 7. Since beta waves can travel to frequencies of about 30 Hz, according to IEEE Standards, this circuit filters frequencies above 31 Hz. The equation given in the previous section can be used to calculate the cut-off frequency for this low-pass filter.
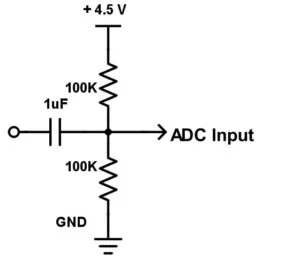
After the low pass filter, we must make sure that the signal is between 0 and 3.3V so that the PIC32’s ADC can register it. The voltage divider circuit shown in Figure 8 below is used to accomplish this.
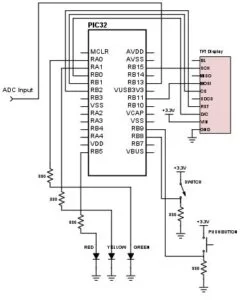
PIC32 Circuit
To avoid a direct ground, the PIC32 circuit was powered by a USB connection through an unplugged laptop. The amplifier circuit’s virtual ground was used to ground it. A voltage divider circuit was used to pass the output of the LPF from the amplifier circuit into the ADC, ensuring that only voltages between 0 and 3.3V are sent to pin 24 on the PIC32. As shown in Figure 9, we also use a TFT for brain wave, FFT, and frequency data display that is wired to the PIC32. Finally, we had connected the PIC32 to a red, yellow, and green LED. They were activated based on the levels of brain activity we were reading, with red denoting higher levels of activity and green denoting lower levels. In the software section, there is a discussion of the specifics of how these activity levels were established.
Software Design
We’ll talk about the PIC32’s operating system in this section. We transfer the amplifier circuit’s output to the PIC’s ADC input (pin 24). Next, we simultaneously display the signal on the TFT, take the signal’s FFT after 512 points, calculate the ratio of relaxed to excited states, and control the LEDs in accordance with that value.
Using TFT as Oscilloscope to Display Brain Waves
We used the TFT as an oscilloscope, which proved to be a fairly simple task since we are unable to be directly connected to power. The signal is shown in two different ways: as a plain signal and as an FFT spectrum. A hardware switch is used to switch between the two. If the switch was set to oscilloscope mode, we read the ADC result and two-shifted it to fit it on the display. A pixel was drawn at the shifted ADC value using an integer counter to increase the x value across the screen. When x reached 320, the point at which the screen was completely filled horizontally, we reset our x position and resumed drawing at x=0. If the switch is set to the FFT mode, we display the spectrum’s magnitude and refresh the screen after each FFT calculation.
FFT of Brain Waves
We used a fixed-point FFT algorithm from Bruce Land’s Digital Signal Processing webpage because an FFT requires a lot of computation. The background math section explains how the 16:16 fixed point arithmetic used by this FFT operates. We use the magnitude of this spectrum to calculate the index of the peak frequency FFT bin after running the fixed point FFT algorithm. Using this information, we calculate the peak frequency using the formula max freq = max fr index * FFT SIZESAMPLING RATE. The sampling rate in this instance is determined by the speed at which the timer reads ADC samples, which is 333.3 times per second. We have set FFT SIZE to be 512 in this case.
Determining Ratios to Control LEDs
The values of all the bins that represent either alpha wave activity (“calm” states) or beta wave activity are added up as we loop through the FFT bins and find the peak frequency index (“excited” states). We have added bins that correspond to frequencies between 5 and 16 Hz for alpha wave thresholds and frequencies between 17 and 40 Hz for beta wave thresholds. According to IEEE standards, these ranges are a little wide, but after optimizing our system, we felt it was crucial to include more data points. We calculate a ratio of “calm” to “excited” states of consciousness by averaging these respective calm and excited bins.
This ratio is what we use to choose the color of the LED. Currently, the red, yellow, and green LED ratio thresholds in our algorithm are hard-coded; however, we will discuss the possibility of user calibration later on this page. For ratios greater than 1.2, our current algorithm illuminates the green LED, signifying a higher proportion of alpha or “calm” waves. We illuminate the red LED, which for ratios less than 0.9 denotes a significant proportion of beta or “excited” waves. We set the yellow LED between these two ranges, indicating that the proportion of alpha and beta waves is almost equal.
Results
Quantitative Results
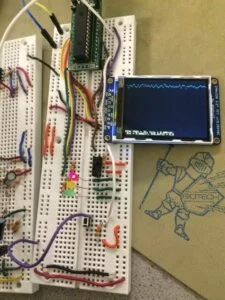
Quantitative measures of our brain waves, such as peak frequency, the sum of all the calm frequency bins, the sum of the excited frequency bins, and the average ratio between these two from three FFT measurements, are shown on our TFT screen. Both the brain wave signal and the FFT spectrum are displayed, depending on the switch’s orientation. Here is a picture of a TFT screen showing brain wave signals.
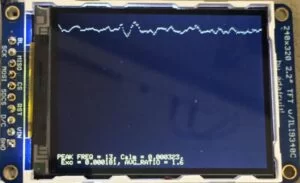
Below is a an image of the TFT screen displaying the FFT spectrum.
Anecdotal Results
We were each able to learn quite a bit about our unique brain waves and the environmental factors that either made our brains more active or more relaxed. Vasu definitely tended to have more relaxed brain waves and frequently turned on the LED, whereas Namita tended to have more active brain waves and typically turned on the Red LED. When it came to setting the LED threshold, these opposing brainwave patterns were very useful.
We were able to discover what stimulated or calmed our minds thanks to our brain waves. Vasu noticed that Namita’s brain waves were more active when there was conflict nearby or when she was intentionally upsetting her. Deep breathing enabled Vasu to unwind once more. When Namita was listening to music or engaging in light conversation with others, she felt less stressed, but when she thought about her schoolwork, she felt stressed once more.
Safety
Because we are connecting electrical components directly to a user’s body in this project, safety was a top priority. In order to prevent shocks, we had to make sure that a user was grounded. This is the reason we powered our amplifiers using the battery circuit that was previously covered. Similar to this, our PIC32 was also only powered by a USB to a laptop that was not plugged in, preventing the user from being directly connected to an AC power source. Additionally, this project’s ground isolation was ensured by connecting the virtual ground from the battery circuit to the PIC ground as well as the user’s arm. While we were testing our analogue circuit, safety was a major concern.
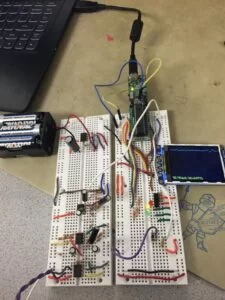
The test mode discussed in the previous section was created because we needed a way to test each stage of the amplifier circuit before connecting electrodes. The entire circuit is shown below; the PIC32 is the only connection to a power source, which is a battery-operated laptop.
Usability
Because all a user needs to do to start taking measurements is to put three electrodes on themselves and press a button, our project is simple to use. Our project could have definitely used some improvements to make some of its features more user-friendly. One drawback of our circuit is its portability. It is difficult to move the entire set up from one location to another because it consists of two whiteboards connected by a lot of wires and a connection to a laptop. The accuracy of this measurement is also highly location-dependent; some areas are more conducive to noise than others.
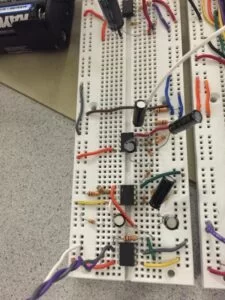
For instance, the lab room, which has a lot of connected electrical equipment, experienced significantly more 60 Hz interference than the ECE lounge, which has a lot less electrical equipment. As previously mentioned, we twisted the jumper cables to reduce interference; a picture of this can be seen below in the amplifier circuit’s input.
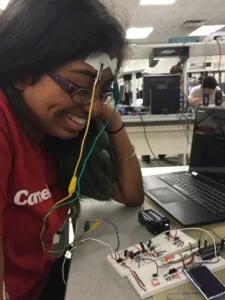
Below is a picture of Namita using the EEG.
The extent to which we can actually control the LEDs is another problem. The time it takes to switch the LEDs to red or green depends on the individual’s brain waves, which vary from person to person. As we previously mentioned, this was challenging for us because Namita tended to be more active and Vasu to be more relaxed. Brain wave activity actually varies not only from person to person, but also within a single person depending on things like how much caffeine they had consumed and how much sleep they had gotten. The use of calibration to establish base brain frequency, which is covered in more detail in the Conclusions section, is one potential remedy for this issue. Here is a picture of the red LED being triggered by more excited brain waves.
Speed of Execution and Accuracy
For this project, the PIC32 runs at a 40 MHz clock speed. ADC measurements are performed 333.3 times per second, and the FFT is executed after 512 ADC samples, or once every 1.5 seconds, which is also the rate at which the TFT screen updates. Because we use fixed point arithmetic, the FFT algorithm does not have a very significant execution time delay. In addition, reducing noise is one of our top priorities as we develop an EEG. We have accomplished this in a variety of ways, including using frequency and averaging filters in software as well as hardware filtering circuits and twisted-pair wires. As a result, we have made an effort to obtain the highest level of measurement accuracy.
By feeding in a signal from the function generator and taking the FFT of that signal, which we know the frequency of, we tested this, for instance, by experimenting with some sampling rates that would produce a very accurate frequency reading measurement. We were able to check our frequency accuracy in this way and discovered that it was within 3%. But there is a loss of accuracy due to the physical design of the circuit. We discovered that if we move too much in one direction, our signal flattens because the EEG circuit is extremely sensitive to movements. However, we have taken this into account by only considering ratios of frequencies above a specific threshold. Future plans call for us to look for better sources of connection from the electrodes to our circuit.
Breathe-Easy EEG in Action
Conclusions
Expectations and Future Modifications
Overall, we were very happy with how our project turned out. We were able to create a working EEG and use brain waves to control LEDs. Since we could display FFT data and use the TFT as an oscilloscope to read brain waves, we could use the TFT to demonstrate that our EEG was functional. If we had more time to develop this, there are a few things we would change. In order to further reduce noise, we would definitely solder the entire circuit rather than use whiteboards. Additionally, our method for separating excited from relaxed brain frequencies has the drawback that it varies from person to person.
Due to time constraints, our attempt to implement a calibration mode that would measure calm versus excited frequencies by having a user simply sit instead of play a frustrating game was unsuccessful.
The first few minutes that a user is connected to the EEG are a good time to collect ADC data points, which could be used to calibrate the thresholds tailored to the particular user. We can get an idea of the maximum and minimum values a particular user might possibly achieve by taking 3–4 minutes worth of ADC values, sorting these values from lowest to highest, and then averaging these values. Then, by performing the FFT on just the highest and lowest values, respectively, we can determine the most ecstatic and the most composed states that a user may experience. Thus, we can establish much more precise thresholds.
Recently, a lot of consumer electronics with brain wave control have been made available for purchase. Therefore, EEG-based therapy has a lot of potential. It has been demonstrated that neurofeedback is an extremely effective technique for promoting relaxation; if a user can see that they are actively relaxing, they are more likely to keep doing so. Despite the fact that this device is only capable of controlling LEDs, the idea can be applied to a wide range of potent applications.
Standards
We met all the standards we discussed in the IEEE Standards section. How we did this was discussed further in the Safety section.
Intellectual Property Considerations
Our project was inspired by the EEG Pong and EEG Magic Cat Ears projects from previous years of this class. Their amplifier and filtering circuits inspired our final circuit design. Our FFT computation code was modified from code written by Bruce Land. We utilized the protothreads library provided by the ECE 4760 course staff.
There are not patent opportunities for our project because there are already numerous patents covering EEG research and neural feedback systems. If we can extend it to control other things, as we discussed in the Future Modifications section, there are potential publishing opportunities for our project.
Ethical Considerations
We ensured we followed the IEEE Code of Ethics to the best of our ability. We ensured that no direct power source was used to power the circuit in order to make decisions that are consistent with the safety of the public and to promptly disclose elements that could put the public at risk. As mentioned in our safety section, the amplifier circuit is battery-powered, and the TFT is powered by a USB plugged into a laptop that is not plugged into a charger.
A user cannot plug their laptop in while using this EEG, according to the safety section. On the basis of the information we have obtained, we must also be truthful and reasonable in our claims. We are aware that not all of the frequencies we are reading are necessarily an exact representation of a user’s brain waves due to noise and interference. We think that by learning about neural feedback systems and gaining more experience with hardware and software design, our project helped us become more technically proficient. Finally, we requested and welcomed feedback on our work from Bruce and the ECE 4760 TAs.
We adopted their suggestions for how to test our circuit and heeded their approach that believes circuit debugging. In the Special Thanks section and the preceding Intellectual Property Considerations section, we have acknowledged those who have directly assisted us as well as any designs that served as an inspiration for or were used in this project.
Legal Considerations
To the best of our ability, when developing our project, we complied with all applicable laws. Our code is either our own or modified open source to ensure safety and the well-being of everyone.
- How does the system power the amplifiers safely?
The system creates a dual-rail virtual ground using six AA batteries, a 2200 µF capacitor, and an LM358 to produce +4.5V and -4.5V rails so no AC power is directly connected to the user. - Can the PIC32 display the EEG signal?
Yes; the PIC32 drives a TFT used as an oscilloscope and to show FFT spectrum and frequency data, switching modes with a hardware switch. - How are alpha and beta activity determined?
The software sums FFT bins corresponding to calm (about 5–16 Hz) and excited (about 17–40 Hz) ranges, averages them, and computes a calm-to-excited ratio. - What LED colors correspond to which brain states?
Green lights for ratio > 1.2 (more alpha/calm), red for ratio < 0.9 (more beta/excited), and yellow for ratios between those thresholds. - How often is the FFT computed and the display updated?
ADC samples are taken at 333.3 Hz; with FFT size 512, the FFT and TFT update occur every 1.5 seconds. - Does the design follow IEEE frequency band standards?
Yes; the project references IEEE definitions for EEG bands and designed HPF/LPF cutoffs to focus on alpha and beta bands per those standards. - How was 60 Hz interference reduced?
They twisted input jumper cables to reduce common-mode 60 Hz noise and used hardware filtering plus software filtering after the FFT. - Can the system be tested without electrodes attached?
Yes; a test circuit and function generator were used to attenuate a 2 Vpp signal down to ~1 mV to simulate brain wave amplitudes for stage-by-stage testing. - What fixed-point format does the FFT use?
The FFT uses 16:16 fixed-point arithmetic to represent values in 32-bit integers for performance. - Is calibration implemented to adapt thresholds per user?
Not in the final system; calibration was planned but not completed due to time constraints, though a calibration approach is described for future work.