Summary of Instrument-Based Color Sonification with the PIC32
Summary: They built a sonification system that senses environmental RGB light with photoresistors and color filters, maps intensity to FM-synthesized instrument sounds (ukulele, bell, drum), and outputs audio via a MCP4822 DAC controlled by a PIC32. OV7670 camera attempts failed, so photoresistors with a CD4051B multiplexer were used. FM synthesis runs in a Timer ISR using fixed-point math and DDS, with ADC sampling at 20 kHz and SPI to the DAC. Results show correct RGB dominance detection after calibration.
Parts used in the Sonification project:
- Microchip PIC32MX250F128B Microcontroller on MicroStick II Module
- Microchip MCP4822 12-bit SPI DAC
- Texas Instruments CD4051B 8-to-1 analog multiplexer
- Adafruit Product ID 1480: 2.2" 18-bit color TFT display
- fitTek Godox CF-07 Universal Color Filters
- CL905L Photoresistors
- 10k resistors for voltage dividers
- SPI wiring (SDO2 mapped to RB5, CS to RB4)
- Prototype board / wiring for ADC channels AN0 and AN11
Sonification
We created a system that can “see” colors in the environment and translate that data to interesting, fun musical instrument beats and patterns.
Overview of the concept
Sonification is the process of turning a collection of data into something that humans can hear. A common implementation is to map color, motion, or other measurements to the 2-Hz to 20kHz range. For sonification of color, this means a mapping of the visible spectrum to humans’ audible spectrum.
While converting the frequency spectrum of a sample of light may be mathematically interesting, it might be more entertaining for humans to experience color and light intensity in a different way: by creating a virtual “orchestra” of instruments that are controlled by intensity levels of light in the red, green, and blue (RGB) ranges.
High Level Design
Originally, we intended to use the OV7670 camera after reading about it on the Arducam site. We intended to extract a few pixel samples from the camera, once we had it configured, and map the RGB elements of each pixel to a specific color frequency using a script we had developed in MATLAB. Then, we would generate a sound spectrum based on the abundance of different frequencies of light. For example, a scene with lots of red color would produce a large amount of low-frequency sound.
After working with the camera for several weeks, we were able to communicate with it using the built-in I2C macros from Microchip’s Peripheral Libraries, but with a little modification, as the OV7670 uses the SCCB specification, which is slightly different than I2C. For those who want to interface the OV7670 with the PIC32, we have included some of the progress we made in the code in the Appendix.
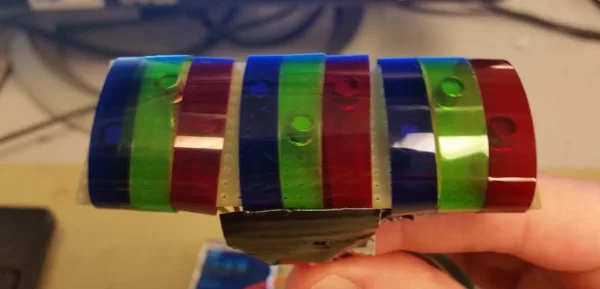
But we were never able to get out meaningful color data from the OV7670. With deadlines approaching and little progress being made, we decided to go the brute-force way: Use photoresistors with color filters. That is in the image you see above.
Program/Hardware Design
We used FM Sound Synthesis method to make a variety types of sound in our final project. FM synthesis algorithm and code were retrieved from ECE4760 course website Digital Signal Processing section. We generated interesting sound by frequency modulation. The basic waveform equation is a sine wave of which the frequency is controlled by another sine wave, shown in Eq 1. It can be wrapped by an exponential envelope, shown in Eq 2.
wave = envelope(main)*sin(Fmain*t+envelope(fm)*(sin(Ffm*t))) Eq.1
envelope = A0*exp(-dk_rate*t)*(1–exp(-attack_rate*t)) Eq.2
Since these calculations occurred in the ISR, we must pay close attention to speed. In order to get good speed and precision, we needed to implement Fixed-point Arithmetic. The Fmain is the fundamental frequency of a sound. The Ffm can be a certain ratio of Fmain. For example, in order to get harmonic frequencies, we probably want Ffm is twice as large as Fmain. The dk_rate represents decay rate in a range of 0 to 1.
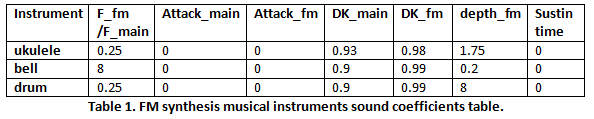
A larger decay rate value makes sound delay faster. The attack_rate controls sound rise rate. If the attack rate is high, the sound will rise faster. We also have a sustain time to hold the amplitude at full output level for a set time before start decaying. Through experimenting on different combinations of these coefficients, we finally chosen three combinations which are corresponding to the sound of three musical instruments, ukulele, bell, and drum for our sonification project, shown in Table 1.
Software Setup
To actually output the sound to the MCP4822 DAC, we used a technique called Direct Digital Synthesis.
For our final project, we constructed the base project file based on previous labs. “TFT_ADC_read.c” is the main operating program. We imported necessary libraries. The header files include updated ProtoThreads libraries (#include “pt_cornell_1_2_1.h”); TFT libraries (#include “config.h”, #include “tft_master.h”, #include “tft_gfx.h”); standard library for string formatting (#include ); math library for FM synthesis algorithm (#include ). The system clock frequency is 40 MHz.
Design of Software
Defined an Instrument struct to save FM synthesis coefficients and rhyme control signals of each instrument’s sound. We constructed three musical instruments, ukulele, bell and drum, and set up their FM synthesis coefficient values as shown in Table 1. Changed instruments frequently, so if any part of the code refers to a different instrument, disregard that – as the parameters are more important. We configured PB3, PA2 and PA3 as three bit select signal of the external 8-to-1 analog multiplexer. Set up Timer 2 with a period of 2000 which is corresponding to a sample rate 20ksamples/sec. We configured ADC as ADC_CLK_MANUAL and turn off the ADC_AUTO_SAMPLING. It allows us manually start sampling and conversion. We opened two channels AN0 and AN11 for reading photoresistor measurements.
UART setup has already been handled by PT_setup(). We added the define statement “#define use_uart_serial” in “config.h” to make it work. The baud rate was defined in “config.h” as 9600. Then, we initialized LCD display and setup system wide interrupts. At the end, we started round-robin scheduler for the three threads. PIC32 sends digital signals to the external 12-bit DAC though SPI channel 2.
Then, we mapped SDO2 (MOSI) to RB5 in group 2 which is pin 14. We configured RB4, pin11, which connected to CS (chip select) of the DAC, as a digital output. We set bit 4 as 1 since we are not transmitting data. Next, we open the SPI channel with 16 bit transfer mode. We generated a 256-entry sine look up table and a 256-entry ramp look up table by a for loop. We initialized a sine table with amplitude one fourth of the maximum value of 12-bit DAC since we summed up three instrument sounds and output to the DAC.
The Interrupt: Generating the Waveforms
We implemented FM synthesis algorithm inside Timer 2 interrupt service routine. The algorithm was applied by fixed point arithmetic in order to make the computations fast enough. We have a play signal to control when the sound replays after a certain amount of time which is controlled by a counter. We used a counter to control the speed of repeated sound. A pattern variable is used to control rhythm pattern of different instruments. The detailed FM synthesis method has been described in FM sound synthesis section above. To transmit wave value to DAC through SPI, it first clears up the CS and forms the 16-bit message by or the data and config bits together. After transmission, it sets back the CS as 1.
Hardware Design
For our hardware, we used the following components:
-Microchip PIC32MX250F128B Microcontroller on MicroStick II Module
-Microchip MCP4822 12-bit SPI DAC
-Texas Instruments CD4051B 8-to-1 analog multiplexer
-Adafruit Product ID 1480: 2.2″ 18-bit color TFT display
-fitTek Godox CF-07 Universal Color Filters
-CL905L Photoresistors
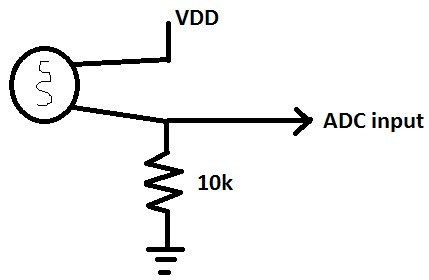
The first thing we did is to try to get the PIC32 to be able to red light intensity values off the photoresistors. To do this, we created a voltage divider from the PIC32’s VDD to GND using the photoresistor and a 10k resistor. As more light hits the photoresistor, its resistance decreases, and the point where we measure analog voltage will experience a voltage increase because the 10k resistor will be dominant.
Here is a basic schematic of the photoresistor with 10k resistor (a more visually pleasing schematic is in the Appendix):
We planned on using 9 photoresistors – three for each instrument we intended to tune. However, we did not have enough pins on the PIC32 to support that many photoresistors. Some of the pins were reserved for SPI communication, and others were inaccessible due to library limitations. Therefore, we decided to use the CD4501B analog mux from Texas Instruments to support 8 of the photoresistors, then use a normal analog input for the 9th.
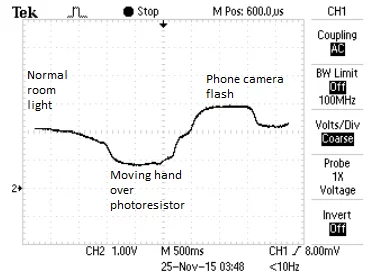
The following is the results of experimenting with how the measured ADC voltage changed with respect to light intensity without a filter:
Results of the Design
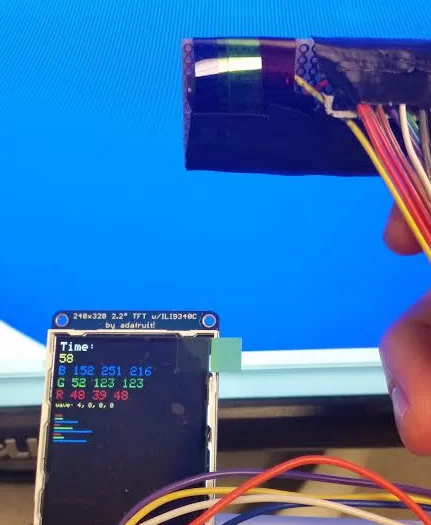
Our best interpretation of a successful project is not necessarily what comes out of the speakers – as we changed the patterns based on the ADC values quite arbitrarily as we debugged. We wanted to get “interesting” sounds to occur as a function of color, which we did – but it is hard to quantify “interesting”. Instead, we decided to measure the project based on whether the device could actually see the proper color in the RGB vector. The image above shows the ADC values, after calibration, while looking at blue light.
The ADC values were calibrated for white light, so this is not a “cheat” image showing false readings of blue dominance. Instead, we see a dominance of blue on the ADC values from the photoresistors, as expected. So any instrument parameter that we set to depend on the blue values would be activated under this condition. We did a similar measurement for red and green. Red was also dominant in its own color, but less so than blue, and green showed the weakest dominance. This is because the green filters let through the most non-compliant light of any of the three RGB filters we used.
Source: Instrument-Based Color Sonification with the PIC32
- What sensors did the project use to detect color?
The project used CL905L photoresistors with fitTek Godox CF-07 color filters to detect RGB light intensities. - Can the PIC32 read multiple photoresistors directly?
No, due to limited pins the team used a CD4051B 8-to-1 analog multiplexer for eight photoresistors and a separate analog input for a ninth. - How is sound generated from the sensor data?
Sensor ADC values control FM synthesis parameters for three instruments (ukulele, bell, drum) implemented in a Timer 2 ISR using fixed-point arithmetic and DDS. - Does the project use a camera to capture color?
They attempted to use an OV7670 camera but could not obtain meaningful color data, so they switched to photoresistors with filters. - What DAC is used to output audio?
Audio is output through a Microchip MCP4822 12-bit SPI DAC driven by the PIC32 via SPI channel 2. - How are ADC samples timed for audio synthesis?
Timer 2 is configured with period 2000 to produce a 20 ksamples/sec sample rate for synthesis. - What mathematical method produces the instrument sounds?
They used frequency modulation (FM) sound synthesis with an exponential envelope and fixed-point arithmetic for speed in the ISR. - How were ADC readings calibrated for color detection?
ADC values were calibrated for white light so RGB dominance measurements reflect actual color dominance without cheating.