MPLAB® X Integrated Development Environment (IDE) is a software program that runs on a PC (Windows®, Mac OS®, Linux®) to develop applications for Microchip microcontrollers and digital signal controllers. It is called an Integrated Development Environment because it provides a single integrated “environment” to develop code for embedded microcontrollers.
MPLAB X IDE brings a host of features to enhance the debug experience during the design phase of your project. Based on the open source NetBeans IDE from Apache Software Foundation, Microchip has been able to add many frequently requested features very quickly and easily, while also providing a much more extensible architecture to bring you even more new features fast – including added support for PIC®, dsPIC®, AVR®, CEC and SAM microcontrollers and digital signal controllers.
Java® Platform and Operating System Direction
In order to align with industry standards and to continue to provide you the best experience when using MPLAB X IDE, we will be making the following changes to the IDE:
- A license-free version of Java will be distributed with MPLAB X IDE starting in version 5.40
- MPLAB X IDE versions up to and including 5.35 will use the last free JRE version 8 from Oracle®
No Oracle JRE license will be required to use any version of MPLAB X IDE
- Operating system support for Windows, Mac OS and Linux will move to 64-bit only starting with MPLAB X IDE version 5.40
- Product support releases will be delivered independently from MPLAB X IDE starting in version 5.30 by moving to a Device File Pack (DFP) system
- A DFP can be applied to MPLAB X IDE version 5.30 or 5.35 to extend the life of the IDE for 32-bit operating systems
- Not all new devices added by a Device File Pack are guaranteed to work in these versions of the IDE
Now Evaluate AVR and SAM MCUs with MPLAB X IDE v5.15
Want to evaluate Microchip’s AVR and SAM microcontrollers, but don’t have time to learn a new ecosystem? Now users of the MPLAB ecosystem can evaluate Microchip’s 8-bit AVR and 32-bit SAM devices through their favorite development tools with the release of MPLAB X IDE version 5.15. In addition, this version of our popular IDE fully supports all Microchip PIC and dsPIC microcontrollers as it always has. MPLAB X IDE version 5.15 gives support for:
- Most AVR families
- SAM E70/S70/V71, SAM D21/C21SAM, SAM E5X/D5X MCU microcontroller families and more
To see if your AVR or SAM device is supported, download MPLAB X IDE version 5.15 and see the New Project dialogue box
In addition to IDE support for AVR and SAM devices, debugging and compiling can be completed for AVR and SAM devices with this list of development tools:
- Get your AVR code off to a head-start with MPLAB Code Configurator
- The high performance MPLAB ICD 4 in-circuit debugger and programmer (SAM support only at this time)
- The ever popular MPLAB PICkit™ 4 in-circuit debugger and programmer
- The affordable MPLAB Snap in-circuit debugger
- The MPLAB XC8 C Compiler for AVR devices
- The MPLAB XC32++ C Compiler for SAM devices
- The AVR GCC Compiler for AVR devices
- The Arm® GCC compiler, for devices with the Arm architecture (SAM)
To view a complete listing of support, see the MPLAB X IDE Device Support List found in the documentation tab below.
Get started with your evaluation of AVR and SAM microcontrollers by either starting a project in Atmel START and importing it into MPLAB X IDE, or start right away inside MPLAB X IDE.
mplab x Screenshots:

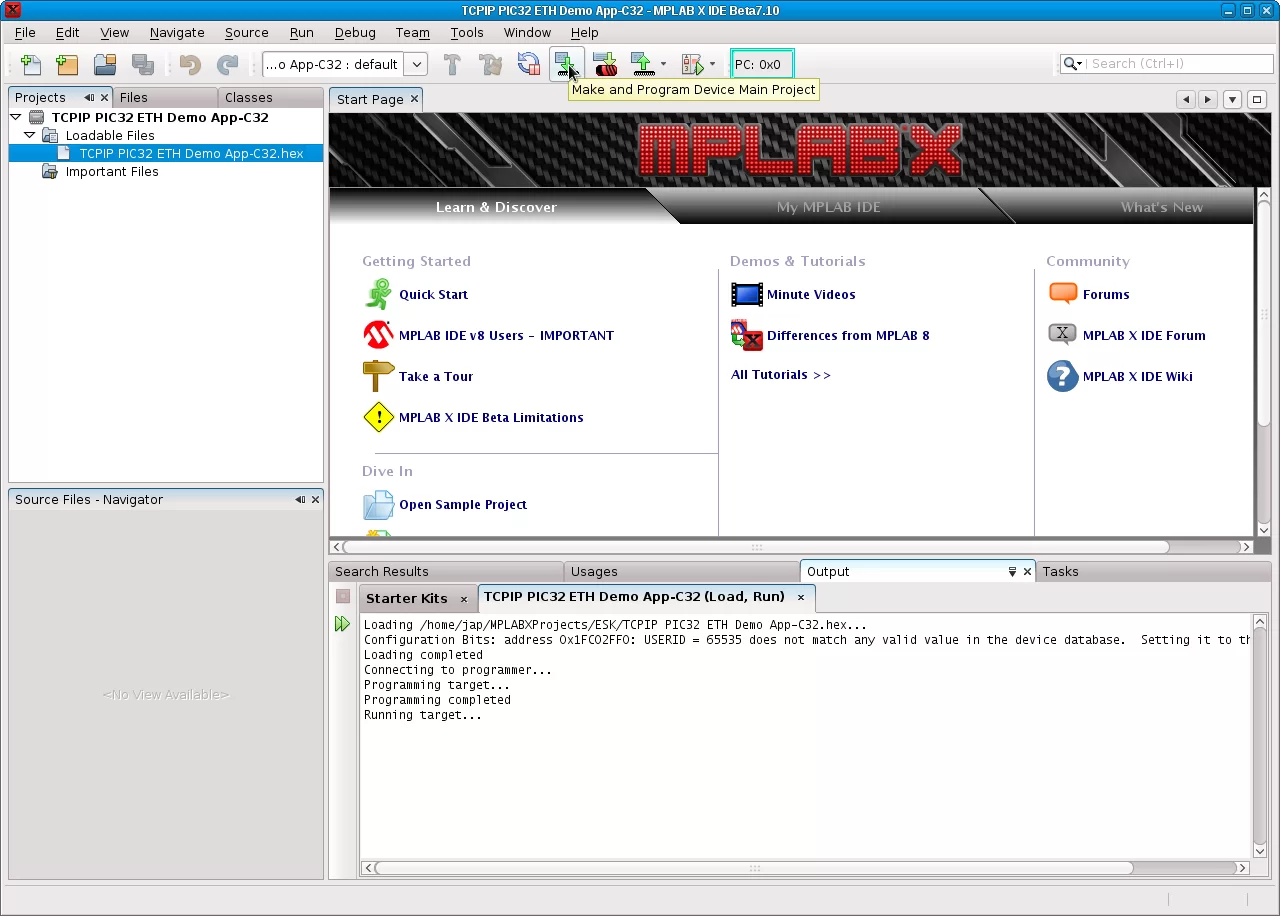
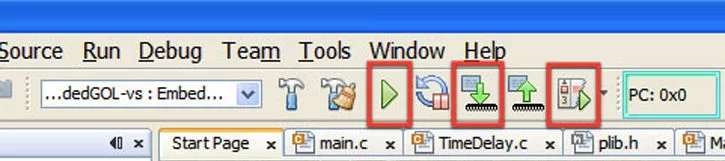
“One Click” Make, Program, Debug / Execute operation. Unlike other IDEs where you build, have to connect to the hardware tool, program the target and then start your debug session.
Under MPLAB X it is all compiled into one action button. Run, Program, or Debug Run starts ‘Make’ which will check for changes and build any relevant updates, connect to the tool program the images and either start a debug session or start an execution of the programmed image. (There is also the option of doing these individually if the customer prefers).
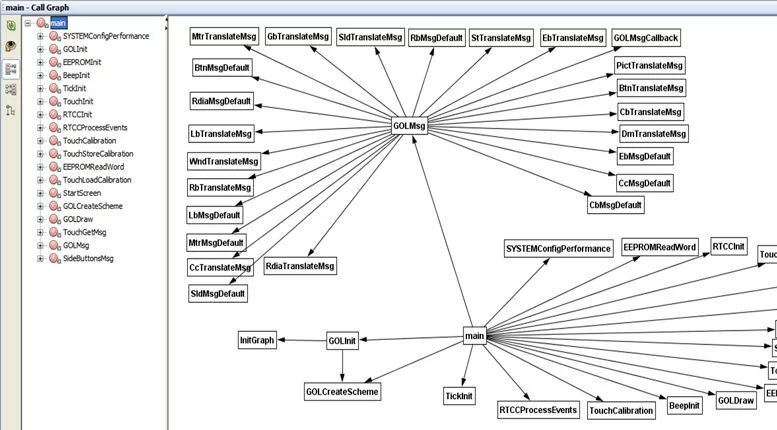
In order to navigate your code or understand a colleague’s code in addition to documentation the Call Graph provides a static call tree of all functions called from other functions. It can also be exported to a Portable Network Graphics (PNG) image.
A single project can now build the same set of source files in many different ways. Each “configuration” has its own compiler options, compiler, hardware tool, and target device.
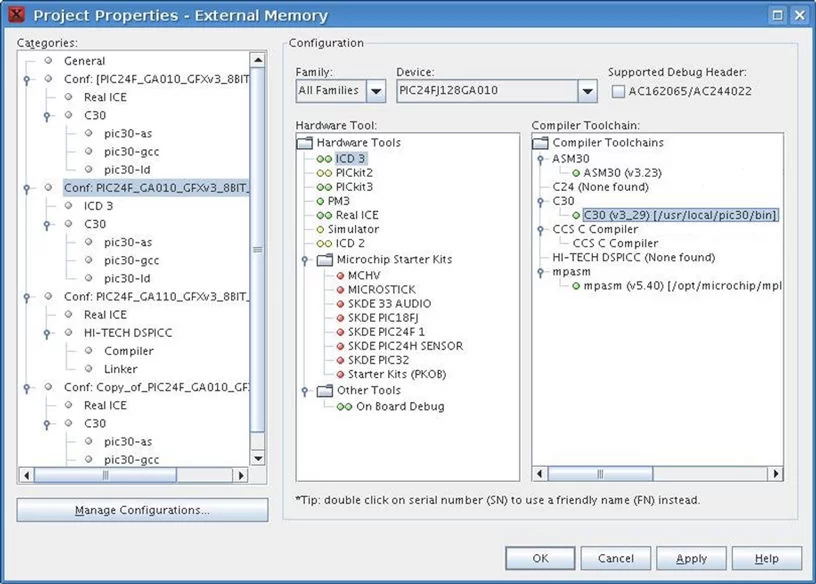
You can have as many versions of a compiler installed as you wish to work with. Each is identified by its own version. For any project, you can select the specific version of your choice. This enables you to use more than one instance of a compiler within the IDE at the same time.
Project configurations can be set to use an older version while trying a new release.
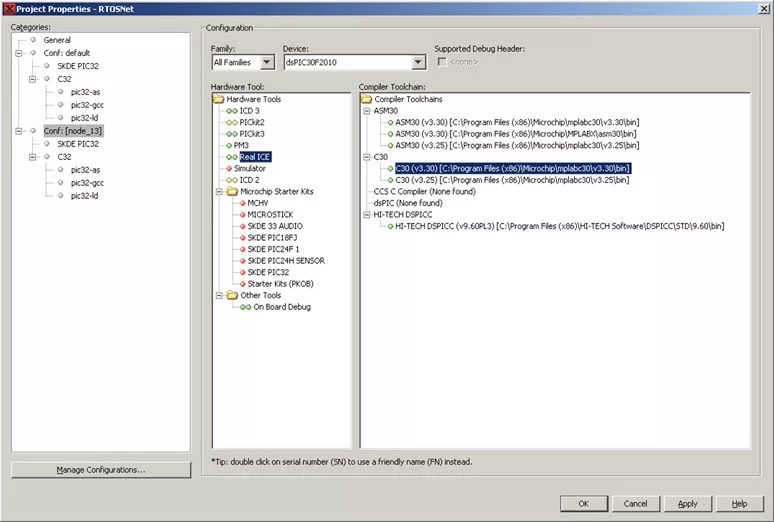
MPLAB X IDE now allows you to have multiple debug tools connected to the computer at the same time. You can select which ever tool you desire for a specific project or configuration within a project (example: Programmer and Simulator in their own configurations). It provides the ability to debug more than one target at the same time using just one installation of MPLAB X IDE.
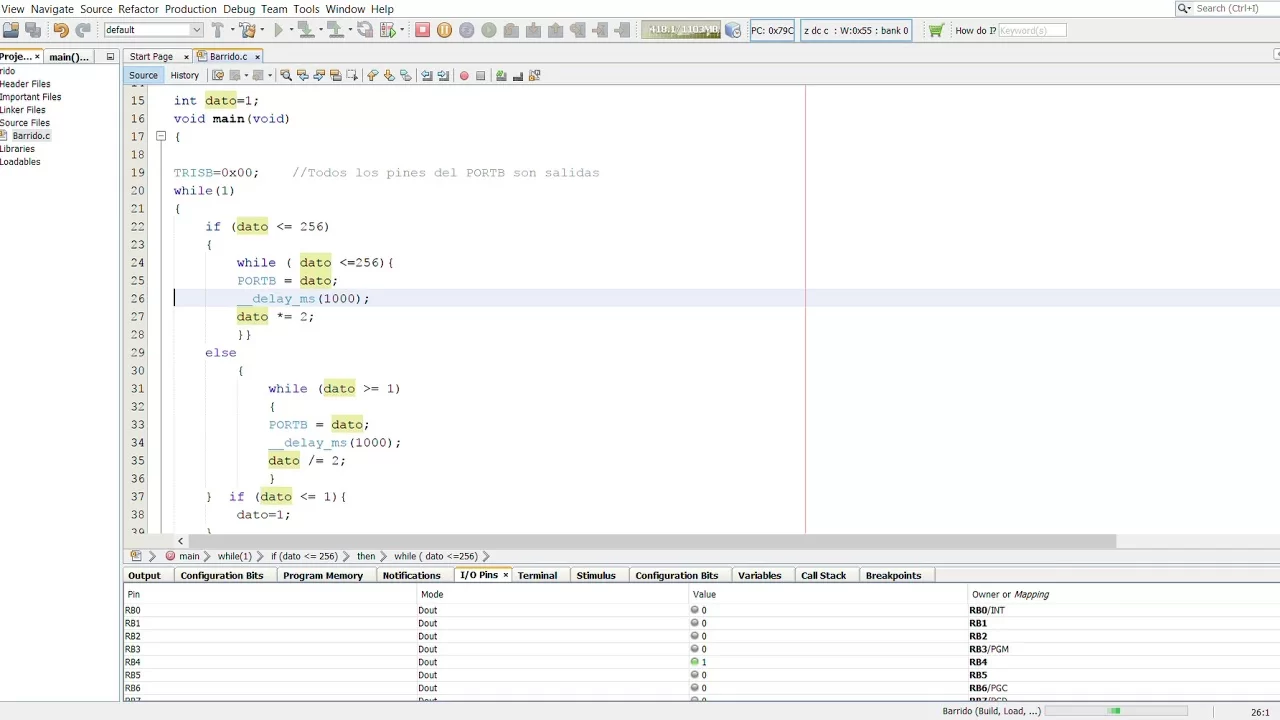
Live parsing means while you type in code if you enter something the C parser does not recognize it will flag it. Many times this allows you to fix code before even compiling.
You can import an existing MPLAB 8 project and develop the code from within either IDE. The same compiler and same debug tools are used so the code is still as production worthy as always. This flexibility allows you to use the MPLAB® X IDE without affecting your MPLAB 8 project.
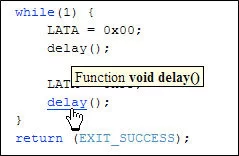
Using the CTRL key and mouse over a function, variable, macro, or include statement allows you to view its declaration. Clicking on the hyperlink will take you right to the source of declaration. Alternatively, you can right click on it and choose Navigate → Go to Declaration from the context menu to jump to its declaration.
Within the IDE there are many existing code templates that can be accessed using a couple of letters then tab (or specified key). You can create your own templates, (even live templates) such that when you enter values into the template area, other areas of code are also populated. For example the ‘func’ active code template shown here. As you enter parameters in the comments, to document the function, the real function is also populated. The developer can select from a template file whenever he creates a new file to add source code to.
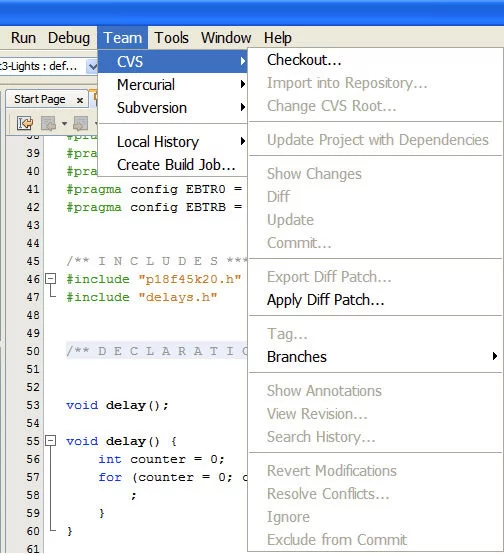
Unsure of what changes you made to the software since the last version control update? Use the Local History utility to visualize changes made. Very useful for backtracking
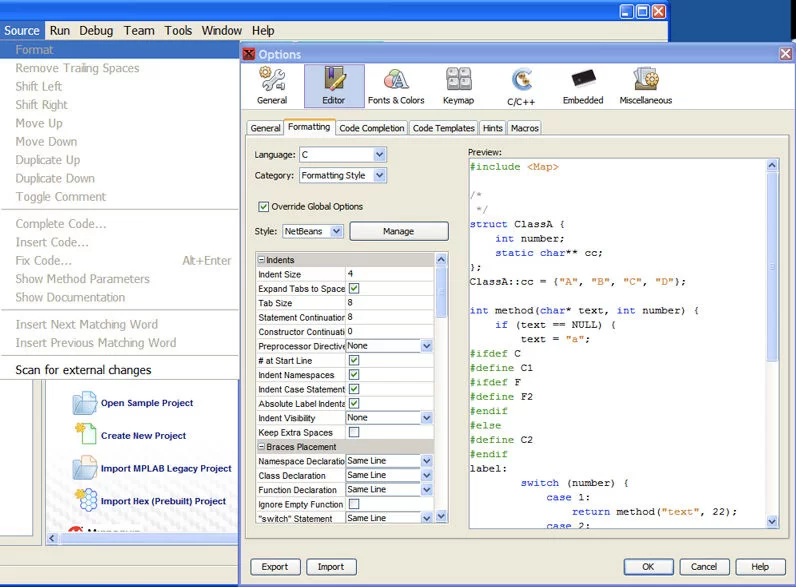
Either an individual or a company can set up a code format standard to be used within the editor. Just select the file to format the code in and menu Source>/Format to reapply the template to your source code.
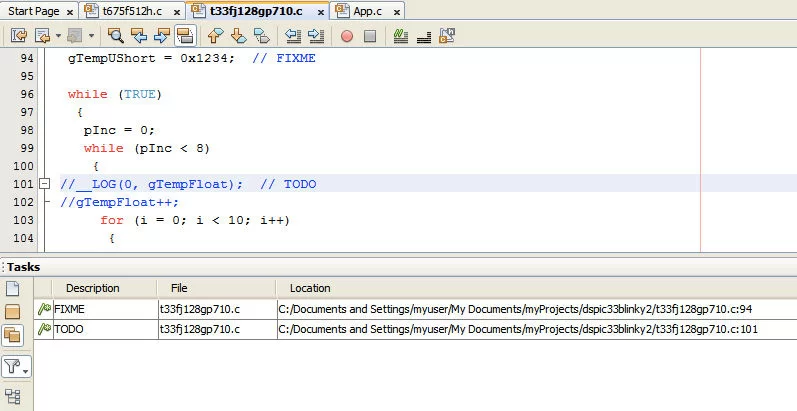
The Tasks operation, automatically scans your code and lists commented lines containing words such as “TODO” or “FIXME”, (the words can be customized under options). Tasks provide a convenient way to keep track of important items you feel need addressing.
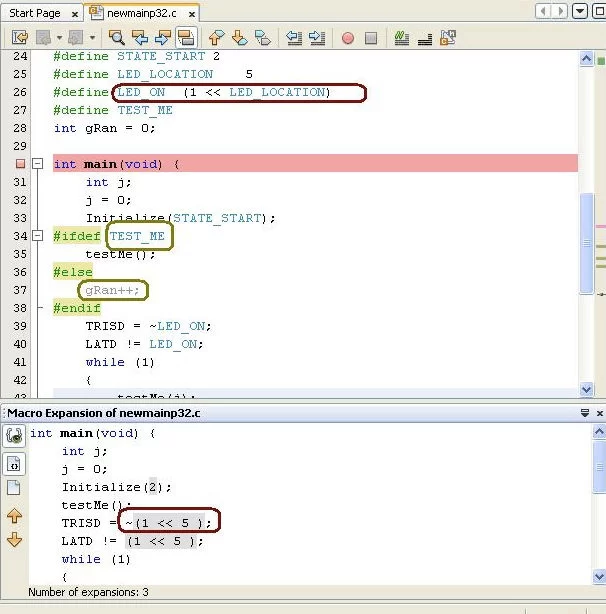
Macros are incredible useful but sometimes they can have unexpected values if they are conditionally defined. This window allows you to see what the compiler will consume after the preprocessor is done. With the expansion view you see exactly what value they expand to. Also, blocks of code not to be compiled are omitted in the view. Also, in the editor window, MPLAB X shows you all the #ifdef/#endif blocks. It uses the comment color (grey by default) to show you sections that will not be included.
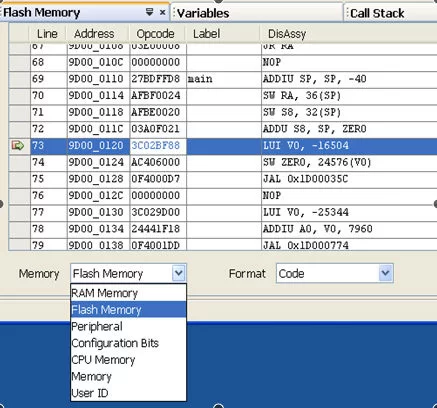
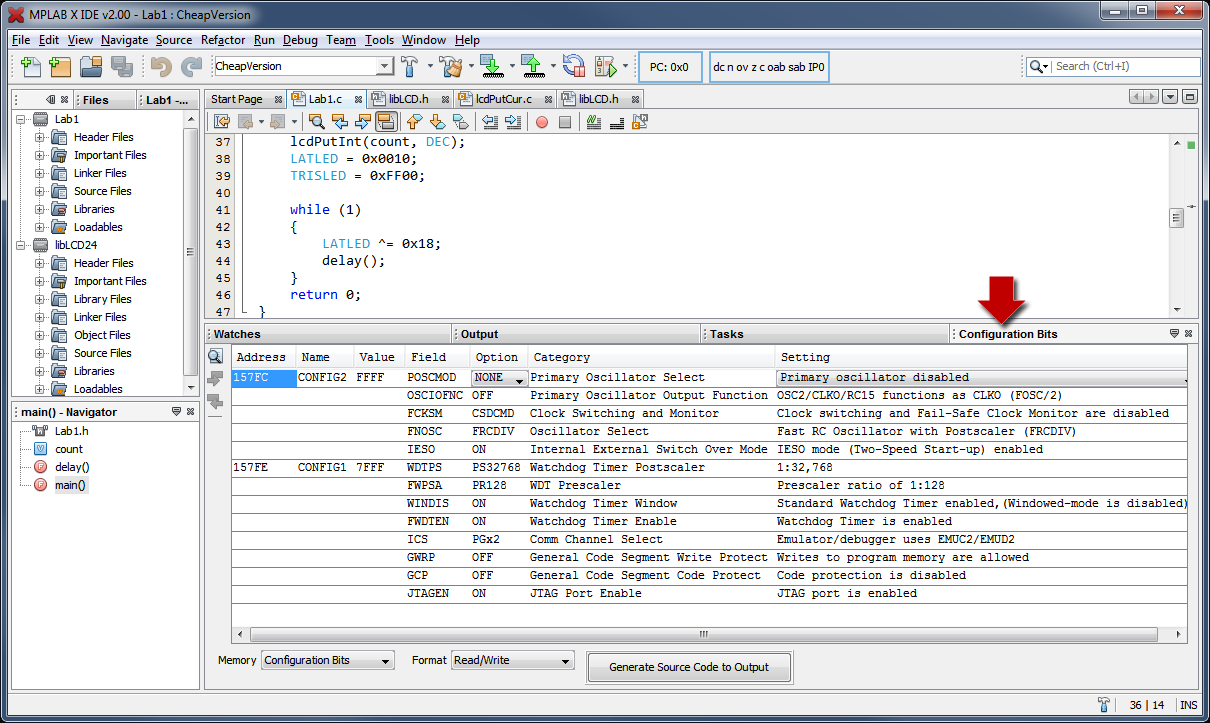
You can change any memory view to look at any type of memory. Formats for those views are also selectable from the dropdowns. This allows a quick view change without going thru the menus.
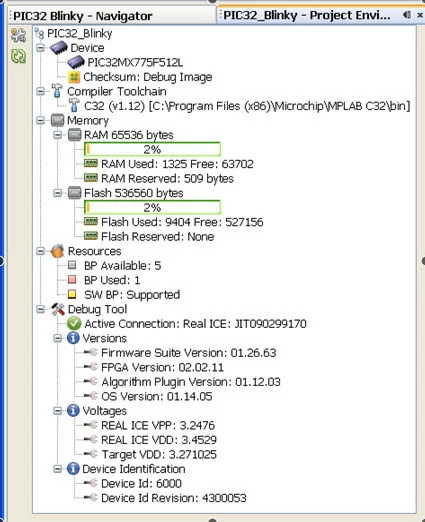
Need one place to summarize you project? For convenience there is a single window that gathers all the relevant project information and its environment. Device name, Debug Tool, Language Build Tool, and Connection state are presented. The Memory section shows Total, Used and Reserved by Debug Tool for RAM and Flash memory. Checksum and Breakpoint (silicon resource) status is also shown. The Debug tool provides additional status for Device ID, firmware versions and voltages.
With this feature you’ll never have to worry about which firmware version you were using. MPLAB will remember it and automatically restore it to the correct version when you connect to the debugger.
Just set it and forget it.
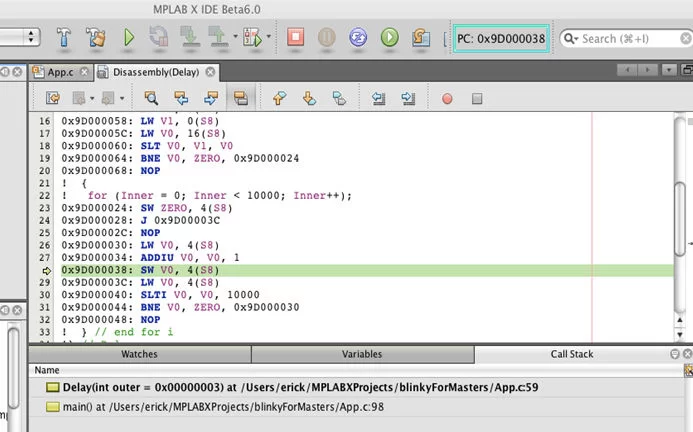
Available only during a debug session and accessed through the Window>/ Debugging menu, this new Disassembly window shows the disassembled memory of the high-level language function in the scope of the current execution point of the debugger. It is extremely useful for debugging program execution at the assembly level.
In addition is the Disassembly listing window which is similar to the one provided in MPLAB IDE v8.x. It is available under the Window>/ Output menu. This window shows the disassembled code generated by the compiler for the current project. It interleaves the disassembled code with the original high-level language source code so it is possible to see what the compiler generates for each line of source code in the project. A project must be built with debugging information, since the display depends upon the debugging line table within the built project, in order to display data.
Use the Variables and Call Stack windows together to browse local variable history of each function in the call chain. Hint: The Variables window is docked at the bottom of the output pane to allow simultaneous interaction and display of the local variables with the selected function in the Call Stack window
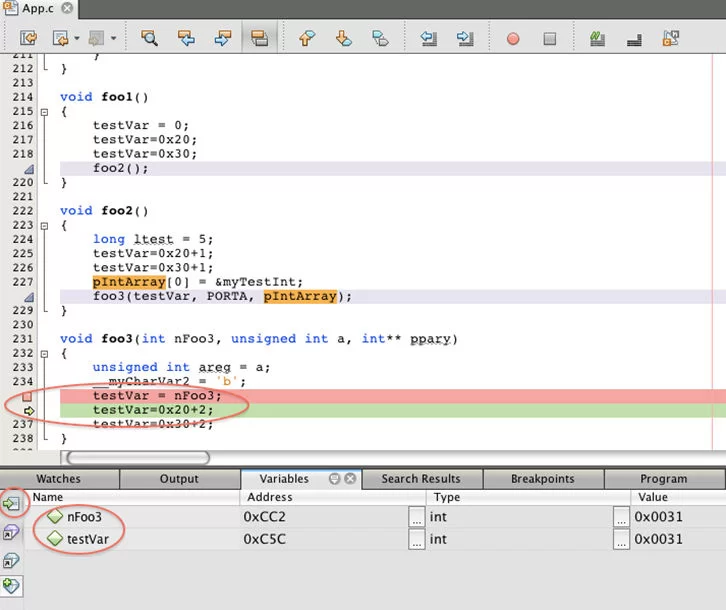
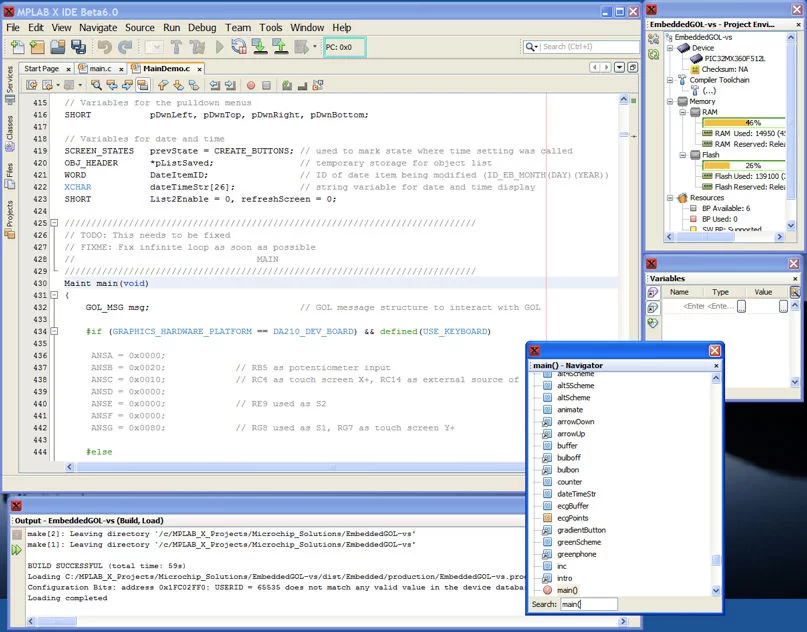
The variables window configured to show only variables used near the program counter location (cursor position). In this mode note that global variables used in the scope of the function can be displayed as well as local variables.
Variables window with display mode configured to show all variables defined in the scope of a function where the program counter is currently located. Notice that the two globally defined variables are excluded from the list in this mode.
mplab x ide download link:
| Title | Date Published | Size | D/L |
|---|---|---|---|
| Windows (x86/x64) | |||
| MPLAB® X IDE v5.10 | 11/2/2018 | 848.7 MB | |
| MPLAB® X IDE Release Notes / User Guide v5.10 | 11/2/2018 | 6.5 MB | |
| Linux 32-Bit and Linux 64-Bit (Required 32-Bit Compatibility Libraries) | |||
| MPLAB® X IDE v5.10 | 11/2/2018 | 802.2 MB | |
| MPLAB® X IDE Release Notes / User Guide v5.10 | 11/2/2018 | 6.5 MB | |
| Mac (10.X) | |||
| MPLAB® X IDE v5.10 | 11/2/2018 | 709.0 MB | |
| MPLAB® X IDE Release Notes / User Guide v5.10 | 11/2/2018 | 6.5 MB | |
mplab x quick video overview:
Source : MPLAB X IDE download
About The Author
Ibrar Ayyub
I am an experienced technical writer holding a Master's degree in computer science from BZU Multan, Pakistan University. With a background spanning various industries, particularly in home automation and engineering, I have honed my skills in crafting clear and concise content. Proficient in leveraging infographics and diagrams, I strive to simplify complex concepts for readers. My strength lies in thorough research and presenting information in a structured and logical format.
Follow Us:LinkedinTwitter