Introduction
We created an affordable Digital Oscilliscope and Function Generator that is able to plot and produce (at the same time) generated electric signals (voltage) changing over time along a calibrated scale. The device provides the basic Digital Oscilliscope functionality of plotting the varying voltage onto a desktop monitor, and the basic Function Generator ability to produce periodic waves of varying amplitudes and frequencies. The user of the device is able to avail some of the more advanced features available on an Oscilliscope that include (but are not limited to): saving generated plots on to an SD card, measuring Peak-to-Peak voltage of a generated plot and altering the time-stepping (zoom) scheme for the electric signals detected to better visualize the plot. Some of the more advanced Function Generation features include: varying frequency, amplitude, and the type of wave (Sine, Square and Sawtooth). All of these Oscilliscope and Function Generation features are available through an intuitive, interactive GUI.
While the Digital Oscilliscopes and Function Generators in lab are functionally useful, they do not make for portable or cost-effective products. Our Digital Oscilliscope and Function Generator provides a simple, easy to use alternative that provides the functionality from both these devices for less than $50; even better, you can carry our device with you in your backpack (and hopefully in your pocket, soon) so that you do not need to come into lab everytime you have to debug a Microcontrollers project or electrical equipment. There are other projects that have tried to create the Digital Oscilliscope feature and Function Generator feature separately. A few similar Digital Oscilliscope projects include BitScope and PiScope. The BitScope project is special hardware desinged to be programmable PC based Oscilloscope, Logic Analyzer, Waveform & Clock generator and Spectrum Analyzer. The most similar project that we could find is the PiScope, but it is still in early development. It, also, uses the an LCD for display (instead of a monitor) and does not have some of the advanced features available from our project (like saving plots and measurin ) and it is not able to generate waves (sine, square, sawtooth). Our project is unique because we provide both a Digital Oscilliscope and Function Generator in one device, and we have some of the advanaced features provided by lab Oscilliscopes. A picture with all components is shown in Figure 2.
High Level Design
Hardware
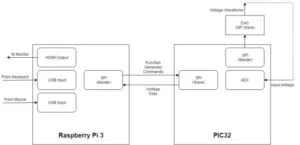
The hardware for the Digital Oscilliscope and Function Generator device consists of a PIC32, a Raspberry Pi, a DAC and a Potentiometer. The Raspberry Pi is responsible for the plotting of data onto a desktop monitor and the PIC32 is exploited for its real-time properties of being able to sample the ADC and generate analog functions (waveforms) with the DAC in a timely fashion. The Raspberry Pi and the PIC32 communicate over SPI. A Potentiometer was added as part of the demo to show that the varying voltages are detected on our Digital Oscilliscope. Voltage divider circuits were created for each of the inputs into the PIC32 MCU. Diagrams for each component can be found in the Hardware section, along with more detailed descriptions of the components.
Software
The software was responsible for leveraging the hardware components, the ADC and DAC, to perform the real-time plotting of the voltage signals input to the ADC and the real-time generation of periodic functions (sine, square, sawtooth) using Direct Digital Synthesis (DDS) techniques. The Raspberry Pi runs a Python GUI that the user interfaces with to avail the Oscilliscope and Function Generator features of our device. A Matplotlib style plot is embedded into the GUI that displays the voltage signal detected on the ADC input pin at any instant in time. The GUI is equipped with easy-to-use and intuitive sliders and buttons that allow the user to change the parameters of the functions that they wish to generate; namely, the user can change the frequency and amplitude of a generated periodic function using sliders and can change the generated wave type by pushing on a button on the provided GUI.
In order to perform the task of plotting the voltage signal detected on the ADC input pin, the software on the PIC32 schedules an interrupt service routine to constantly read a batch of voltages on the ADC pin. The PIC32 packages and sends the voltage signal information, read after analog to digtal conversion (on the ADC), to the Raspberry Pi over the SPI protocol. Do note that SPI protocol is full-duplex and this means that communication is happening both ways constantly. Hence, we leveraged this feature of the protocol to also send information about the function generation parameters (selected by the user on the GUI) to the PIC32 that used DDS techniques to generate a waveform with the DAC. While the user gets to select the input parameters for function generation, they will also observe a Matplotlib plot that is plotting the voltage signal detected by the PIC32’s ADC input pin. The Raspberry Pi side software will buffer the digital voltage data sent over via SPI from the PIC32 and will plot it onto the GUI every 30 ms on the embedded Matplotlib plot. The 30 ms is chosen to ensure that the user does not visually observe a lag on the GUI plot.
Hardware
Schematic
Below is main schematic:
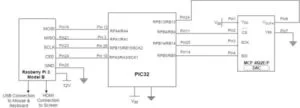
Pinout
Table 1 is a list of the MCU pin assignment (PIC32 and Raspberry Pi) with respect to the above mentioned hardware inputs and outputs (as it was demoed). Namely, the DAC does not need to output does not need to be plugged into the ADC input, but it was for the demo purposes (to show both the Function Generation and Oscilliscope feature at the same time).
| Component | Description | PIC32 Pin | Raspberry Pi Pin | Peripheral DAC Pin |
| ADC | ADC input | 24 (PPS AN11) | ||
| DAC | DAC output to ADC Input | 24 (PPS AN11) | 8 | |
| DAC-PIC32 SPI Communication | MOSI Pin | 14 | 4 | |
| DAC-PIC32 SPI Communication | CS Pin | 11 | 2 | |
| DAC-PIC32 SPI Communication | SPI Clock (SCLK) | 26 | 3 | |
| Pi-PIC32 SPI Communication | MOSI Pin | 12 | 19 | |
| Pi-PIC32 Communication | MISO Pin | 3 | 21 | |
| Pi-PIC32 Communication | CS Pin | 10 | 24 | |
| Pi-PIC32 Communication | SPI Clock (SCLK) | 26 | 23 | |
| Potentiometer | Varying Voltage |
PIC32
For the microcontroller responsible for reading data as well as generating functions/waveforms, we chose to use the PIC32. As previously stated, we wanted to use a microcontroller capable of operating very quickly in real time so that it can display and read values at a very high frequency. This microcontroller sufficed for this goal, although this design may have benefitted from a more expensive option. To break out the PIC32, we used the Microstick 2. This allowed code to be uploaded to the PIC32 via USB. This also allowed us to plug the PIC32 into the breadboard so that we could easily attach wires to pins.
In our specific project, we ran the PIC32 at the default 40 MHz. It may have been possible to increase this frequency, allowing us to acquire and send samples quicker. However, this allowed for a simpler design. The PIC32 was also programmed using a MPLAB v3.05 in conjunction with the XC32 compiler provided by Microchip Technologies.
Raspberry Pi 3
Although the PIC32 excels at real time computation and calculation, we were seeking a device capable of generating a simple and easy to use user interface. This Raspberry Pi allowed us to do this with ease. To prepare the Raspberry Pi, we needed to install Linux. Once this was completed, we could use the Raspberry Pi as we would any other computer. The Raspberry Pi would then function as a device that would be capable of controlling the PIC32 (in SPI master mode), instructing it to send data for the Oscilliscope and Function generation capabilities of our device. In response, the PIC32 would (as slave) follow the instructions sent by the Pi and correspondingly send back data the other way for the Oscilliscope function for the PicBerry, in particular.
MCP4822
This IC is a 12 bit SPI controlled digital to analog converter. This was used in conjunction with the PIC32 to create voltage functions using direct digital synthesis.
Potentiometer
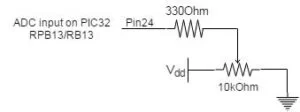
A potentiometer was used to test the design initially when the function generator was not working. This was set so that we could sweep the voltage between 3.3 and 0 V. It was connected to the analog to digital converter in the PIC32. This served as a quick way to verify the Oscilliscope functionality of our device.
Software
PIC32
Oscilloscope
The oscilloscope was implemented using an ADC. First, we needed to configure the ADC so that it operates properly. This was done by passing parameters to the OpenADC10() function. Our parameters were as follows:
- ADC_FORMAT_INTG16 – Output of the ADC is a 16 bit unsigned integer
- ADC_CLK_AUTO – Trigger conversion automatically
- ADC_AUTO_SAMPLING_ON – Sample automatically
- ADC_VREF_AVDD_AVSS – Set VDD and VSS to VREF to make the range of readable voltages
- ADC_OFFSET_CAL_DISABLE – Disable offset calibration mode
- ADC_SCAN_OFF – Turn off scan mode
- ADC_ALT_BUF_OFF – Turn off alternative buffer (single output)
- ADC_ALT_INPUT_OFF – Turn off alternative input (single input)
- ADC_CONV_CLK_PB – Use peripheral bus clock (PBCLK)
- ADC_SAMPLE_TIME_5 – Set sample time
- ADC_CONV_CLK_Tcy2 – Divide PBCLK by 2
- ENABLE_AN9_ANA – Use AN9 (pin 26)
- SKIP_SCAN_ALL – Disable scan
- ADC_CH0_NEG_SAMPLEA_NVREF – Use ground for input A channel 0
- ADC_CH0_POS_SAMPLEA_AN9 – Use AN9 for input A
We also used set the ground as the negative reference and AN4 for the input using the SetChanADC10 function. The ADC was read in an ISR running at 25 kHz (discussed in the Function Generator section). The value was added to a buffer of 600 samples before being sent to the Raspberry Pi.
Function Generator
The function generator was implemented by using direct digital synthesis and a 12 bit SPI controlled DAC. We decided to sample the function tables (sine, square, and sawtooth) at 25 kHz. We chose 25 kHz because this value is just high enough such that the resulting sine wave’s highest error value is over 20 dB in magnitude lower than the fundamental. We utilized a timer which triggered an interrupt to sample the function tables at the desired frequency. The timer was set to trigger every 1600 clock cycles (this is the result of dividing the clock frequency of 40 MHz by the sample frequency of 25 kHz).
Next, the function tables were generated. Each table contained 256 values ranging from -1023 to 1023 which described a full cycle of the function. The cosine table was generated using a cosine function multiplied by 1023. The square wave table was generated by setting half the table to -1023 and the other half to 1023. The saw tooth wave table was generated by linearly ascending and descending between -1023 and 1023.
We also needed to create a SPI channel between the PIC32 and the DAC. This was done by creating and opening a channel in the PIC32 code. We also declared this as 16 bits wide so that it could transmit an entire 12 bit packet in one transmission.
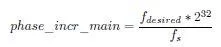
The bulk of DDS is performed in the ISR. Two of the main variables involved in DDS are phase_accum_main and phase_incr_main. The unsigned integer phase_accum_main is responsible for indexing through the cosine table. The top 8 bits are used directly as an index, and the last 24 bits are used to create more time between increments of the top 8. The unsigned integer phase_incr_main is used to increment phase_accum_main each time the ISR is called. This variable changes based on the desired frequency. We can calculate this variable by using the following formula:
This value is added to phase_accum_main. Before the function tables are indexed, the ISR checks for which function type is being used by checking the wType variable. Then, phase_accum_main is shifted right by 24 such that only the top 8 bits remain. It is then used to index this function table. The resulting value is multiplied by the amplitude is defined by the user. This will be discussed later. Finally, the chip select is set low to indicate the start of a transaction. The packet which is sent consists of the data from the function table added to an offset of 2048 so that it cannot be negative. This is OR’ed with configuration bits to make the DAC output to channel A. The chip select is then set high to indicate the end of the transaction.
SPI Communication
In our SPI scheme, the Raspberry Pi is the master and the PIC32 is the slave. The PIC32 is constantly sending new readings to the Raspberry Pi for plotting, and the Raspberry Pi occasionally sends a packet to the PIC32 to change the output of the function generator. The packet sent from the Pi to the PIC32 was packed such that two least significant bytes contained the frequency, the second most significant byte containedthe amplitude, and the most significant byte contained the wave type (0 for sine, 1 for square, and 2 for sawtooth). THe packet sent from the PIC32 to the Raspberry Pi is 16 bits of voltage data (if it is not the header packet).
First, we needed to open an SPI channel to implement this functionality. Using the OpenSPI2() function, we initialized the SPI to be in 32 bit mode as the slave. We chose to use 32 bits so that the values it sends to the Raspberry Pi can have a high degree of accuracy while also allowing a larger range for the settings sent by the Raspberry Pi (ie. Wave type, frequency, and amplitude).
Once this was initialized, we needed to send data to the Raspberry Pi. We also needed to be able to receive data from the Raspberry Pi whenever available. So, whenever data is sent, we also check to see if there is a packet from the Raspberry Pi. If there is, it is decomposed as follows:
amplitudeData = (data >> 16) & 0xFF;
amplitude = fix2float7(amplitudeData);
wType = (data >> 24) & 0x3;
Where fix2float7 represents a function used to turn the 8 bit number received into a fixed point number with the point after the first bit. Before sending data, we checked to make sure that the buffer assigned in the ISR is full of data. If this is the case, then we send predefined packet to indicate the start of the buffer to the Raspberry Pi. We decided this to be 0xFFFF0000. If the buffer was not full, we would send a 0. We then iterate through the buffer to convert and transmit each value. The output of the ADC is a value between 1008 and 0, so to normalize this to a voltage, we take the value in the buffer, divide it by 1008, and multiply it by 3.3. We then convert this value to a fixed point 16 bit number. It is then transmitted via SPI to the Raspberry Pi.
Raspberry Pi
Matplotlib
The GUI for the oscilloscope and function generator was based on Matplotlib. This library allowed us to generate and update graphs using the data sent from the PIC32. It also allowed us to use “widgets” to allow the user to change the function generator’s settings.
In our final design, we used the animation library to update the plot in real time. In this setup, we had a function called “animate” which was called repeatedly.
SPI Communication
We used the spidev library to run SPI communication on the Raspberry Pi. We opened the channel and set the SPI frequency to 20 MHz. Then, we created a function called spi_writeread to read and write data to the PIC32. It would first set the chip select low to indicate the start of a transaction, send the data that was given as the argument of the function, and then read data from SPI. It then set the chip select high to end the transaction and returned the voltage that it received via SPI.
Oscilloscope
First, the Raspberry Pi would repeatedly read from the SPI channel using the spi_writeread function we defined earlier to look for the header packet. Once this was found, we received the rest of the 600 samples sent from the PIC32. We chose 600 because it allowed us to plot a significant amount of data while not slowing down the animation a significant amount. This data was appended to a list. Then, this data was set as the data described by a line in the plot. We would then update the plot so that the data appeared in the oscilloscope screen.
We also implemented an X and Y zoom. Adjusting either of these sliders would result in either extending or shrinking the respective axis. We also implemented plot saving, which was triggered by clicking the radio buttons on the left hand side of the GUI.
Function Generator
To allow function generator capabilities, we wanted to create a GUI so that the user could easily control parameters. Luckily, Matplotlib allows the use of “widgets.” We sliders for the frequency and amplitude as well as a radio button for selecting the wave type. We connected these values to the function fcn_gen() so that whenever any of these values were changed, the function would be called. This function generated a 32 bit packet to be sent to the PIC32, as described by this diagram:
The function spi_writeread() was called with this data as the argument to be sent to the PIC32 and unpacked.
Testing & Debugging
We tested and debugged using both hardware and software techniques. Although, given the nature of our project we had to rely heavily on debugging using the Oscilliscope. The general methodology that we used for testing was to test smaller chunks of code before proceeding onto a different component. That is, we first ensured that the peripherals were setup correctly, then we moved on to implementing and testing the SPI interface on each of the Microcontroller, followed by implementing the plotting, then the GUI for the project. We realized that we relied more heavily on debugging techniques, as opposed to automated software testing, due to the nature of the project. Below, we delineated some of the specific debugging and testing techniques that we deployed throughout the project:
Software Testing & Debugging
We relied on software testing to be able to resolve issues with the GUI (whether mouseclicks were getting detected). We attempted to add tests for the SPI transactions between the two devices by echoing back what was sent across the Bus by the other device, but we found that this was not useful (as it became hard to determine where the SPI transaction was failing); the reasons for failures became clear once we hooked up the CS, MOSI, MISO, SCLK pins to the Lab Oscilliscope. Lastly, in software, we implemented a loop back test (also, used for demo) to hook the DAC output into the ADC input to be able to verify that we were indeed displaying the same wave on the implemented Oscilliscope that we had generated using the implemented Function Generated.
Hardware (Lab Oscilliscope) Testing & Debugging
We relied on the Lab Oscilliscope heavily to be able to first detect the integrity of the SPI communication between the PIC32 and the Pi (as mentioned above); the Oscilliscope was particularly helpful in determining whether we had set the Clock Polarity (CPOL) correctly and other SPI parameters. We, also, used the Lab Oscilliscope to be able to verify that our own oscilliscope output matched the output on the Lab Oscilliscope, given a period function was generated from the available Function Generators in Lab.
Results
The results of this project is a very inexensive effective oscilloscope and function generator. This design is capable of achieving surprising accuracy while maintaining a pleasing and easy user interface. When considered against equipment which can run up to thousands of dollars, our design is incredibly effective. However, there is definitely room for improvement with this design, which is a result of the limited time and resources.
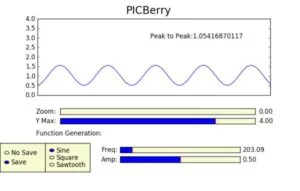
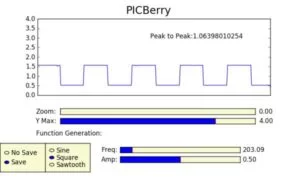
Our oscilloscope design was capable of receiving and displaying roughly 2000 samples per second. It was also capable of reading frequencies of up to roughly 2 kHz before the signal began to become fragmented and difficult to read as you can see in Figure 10. A typical oscilloscope is capable of reading in the range of giga samples per second while also being capable of displaying signals in the range of mHz. Furthermore, our oscilloscope was only capable of reading signals between 0 and 3.3 Volts due to the fact that the PIC32 is powered by and only capable of outputting in this range. This limitation could be circumvented using hardware such as voltage dividers, however, we did not have the time to implement such augmentations. Our design also featured functionality present in oscilloscopes such as zooming and measurements of peak to peak voltages. However, these were also somewhat limited. We could not pan or offset the wave. We also did not have any triggering. A typical oscilliscope should also be capable of many different measurements such as frequency.
Our function generator design was capable of outputting sine waves, square waves, and sawtooth waves. It also gave the user direct control over the amplitude and frequency. It was capable of generating waves in between 0 and 3.3 V and theothetically up to roughly 12 kHz (since the DAC was sampling at 25 kHz). However, there was noticable fragmentation because of the DAC at lower frequencies as seen in Figure 14 where the DAC is sending a 2 kHz wave. A typical function generator should be able to create waves at a wide range of voltages and should be capable of reaching frequencies in the range of MHz.
Although it is clear that the results of our design lack some features of professional oscilliscopes and function generators, it is important to consider that our oscilliscope can be made in potentially $20 (we used the more expensive Raspberry Pi, due to a lack of access to the cheaper one), which is about 20 times cheaper than even than the most basic oscilliscopes and function generators available in the market. All in all, we were capable of reaching a high degree of success with very limited resources and time.
There are a number of significant difficulties that we faced throughout the process of creating this project. The largest setback was a result of a faulty plotting scheme using Matplotlib and the ADC. Our first approach to this project was to attempt to plot points in real time, i.e. the plot would update as it received points; the thought was that this would greatly increase performance as we could easily context switch between plotting and data communication (collection) via SPI on the Raspberry Pi side. On the PIC32 side, we were reading and sending one ADC sample at a time. This led us to use multiprocessing, where a data collection process would send data via a queue to a plotting function. We spent a significant amount of time implementing multiprocessing. Eventually, we realized that reading data from the ADC and sending data it over SPI point-by-point (or one-by-one) from the PIC32 led to slinkying wave plotted on the GUI with the frequency of the waveform constantly changing, even though such a behaviour was not characteristic of the wave generated. Since the ADC was sampling the input pin at variable instants in time, we began to sample the ADC periodically using timer interrupts. This approach on the PIC32 lead us to using an approach where the data would be collected and sent over SPI, and plotted in batches (all at once) on the Raspberry Pi. However, this approach combined with the ADC sampling in a timer interrupt would still lead to “breathing,” where various cycles would expand and shrink. To fix this, we changed the code so that it would only transmit batches of data via SPI to be displayed as a batch on the Raspberry Pi. After spending a very long time attempting to adapt the multiprocessing code, we discovered that since we are no longer plotting in real time point by point, the multiprocessing was somewhat useless. This lead to us deleting most of our Python code and restarting using Matplotlib’s animation library. This was extremely time consuming, however, this lead to a much better and consistent design.
Most other difficulties besides this were fairly minor. For instance, we had a lot of trouble synchronizing SPI communication between the PIC32 and Raspberry Pi. The SPI peripheral on the PIC32 side had to be configured correctly; it was hard to determine what the correct transmission width and clock polarities due to the inadequate documentation for the PIC32 in SPI slave mode. After a significant amount of trial and error, we eventually got a very reliable stream of communication between the two devices.
Pictures
Below are pictures of the some of the plots that we generated with the GUI and the PiBerry device.
Videos
Below is a video demonstrating some of the features of the PicBerry Digital Oscilliscope and Function Generator
Conclusion
Expectations and Future Work
We were able to create a Digital Oscilliscope and Function Generator that successfully emulated the Tektronix Digital Oscilliscope and Function Generator in lab. As with any course design project, we do have some room for improvement though. If we were to repeat the design and construction of the project, we would attempt to add a cursor to measure the properties of a periodic function, FFT support and setup triggers. Essentially, we would try to add as more advanced features provided by the Digital Oscilliscope and Function Generator.
We used Python’s Matplotlib for providing our plots but we recognized that it did not have the ability to update plots with a stream of data updates easily. We may try to use another library or another language (MATLAB) that would fit the needs of our project better.
Finally, we would create a casing for the two Microcontrollers, in order to make our product more aesthetically appealing and functionally easier to use.
Applicable Standards
We used SPI serial communication (a defacto standard developed by Motorolla in the 1980s) to interface between the PIC32 and the Raspberry Pi. We also note that in order to use the PicBerry Oscilliscope and Function Generator, the user is required to interact with a standard click based interface (also called Point and click); thus, we will include it as a standard in our project.
Ethical Considerations
With regards to the IEEE Code of Ethics, our team adhered to all 10 properties under Section 7 (Professional Activities). In particular, by stating the limitations of the PicBerry in terms of supported frequencies on the PicBerry Oscilliscope, unavailability of various Oscilliscope and Function Generator features, we followed the commitment “to be honest and realistic in stating claims or estimates based on available data.” Further, proper credit was given to individuals and the documentation that we used to guide us through the design and implementation of the project. In terms of preventing any possible injury, safety was always ensured while using the PicBerry Oscilliscope and Function Generator by avoiding contact with electric signals used to power up both the PIC32 and Pi; we also, made sure to ground all peripherals correctly and added a voltage divider circuit to prevent the pins on the PIC32 and Pi from blowing out (and potentially causing a fire). Lastly, contact with and use of the device (namely, the circuitry, Pi, and PIC32) was limited to group members working on the project, all of whom were qualified to carefully handle the device and work on the project.
With respect to the commitment to “to improve the understanding of technology; its appropriate application, and potential consequences,” our team adhered to this property by ensuring the PicBerry was only used for its intended purpose of serving as a function generator and a keyboard that interfaces via USB with a computer.
Legal and IP Considerations
In terms of legal considerations, we do not foresee any issues, as all parts were taken from the lab supply of components, to which we were granted access by our instructor Professor Bruce Land and Professor Joe Skovira. No sample parts were used from manufacturers, and so we did not need to sign any non-disclosure agreements. We did not reverse-engineer any designs, nor did we outright use any other individual’s designs. Additionally, we did not find any existing products that exactly matched our particular digital oscilliscope and function generator device; however, there are a couple of similar projects that have been done using a Raspberry Pi. This project was primarily educational and we do not plan to manufacture Digital Oscilliscope and Function Generator for sale. Thus, we will not violate any intellectual property patent/trademark issues. We do foresee publishing opportunities online as well as in various journals and magazine articles that focus on our particular method of implementation.
About The Author
Muhammad Bilal
I am a highly skilled and motivated individual with a Master's degree in Computer Science. I have extensive experience in technical writing and a deep understanding of SEO practices.