We will be making a STONE LCD drawing enabled application. First, I’ll share some of my experiences I’ve been having trying to graph the drawing process, and as we did in the previous application, we’re going to send one byte of data from the serial port to complete the drawing process. Each dot that we’re going to print is 16 bits, which is 2 bytes. So the maximum number we can display on the screen is 65536, but if we try to print it correctly, the screen will be off the vertical axis. So the number we send is either divided by that number or we scale it using the settings of the on-screen Live Curve tool. Let me show you how it works. I think the screen can be transmitted as a maximum number of bytes of data boxes and can be sent at multiple points in a packet. So the drawing process is faster than the Nextion screen. It also makes it easier to draw a fixed number of applications (e.g. drawing FFT data) to implement. So I think this is a useful screen to draw the process. I wish we could remove or change line density settings from the Serial Port screen. I think the most important thing is that after a while, the graph is zero. So when you send a lot of dots behind it, all the dots are deleted and it redraws from zero so that it can’t be requested in some cases. Now let’s go back to the application.
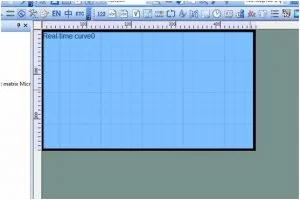
In the application, we’ll use the two ADC channels at STM32 to plot the values read on the STONE LCD. See How to graph before passing the application details. In the STONE LCD TOOL Editor, this is called “Real Time Curve”. There are settings that can be used with the on-screen graphing tools. Let’s take a look at all of these settings. The position on the editor screen will be shown on the image below.
After selecting this tool, we specify where we want the screen design to work graphically. So the data that we send from the serial port will be plotted in this area that we have specified. Now let’s look at some of the settings that affect the drawing process.
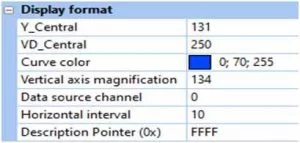
The image shown above is in the format of the image that will be highlighted below. You can view the description by clicking on Details.
Y_Central: calculable simple (Ymax-Ymin)/2
VD_Central: the average value of the electronic scale to be sent. (Vmax – Vmin)/2
Vertical axis magnification You do not have to randomly identify this value. Basically, it should be written down instead of calculated: n=(Ymax Ymin)*256/(Vmax Vmin)
Data source channel: the channel number of the drawing used. At least 0 equals 7. At least 8 different drawings can be drawn as well as the highest and lowest values. A second graph should be used to draw the different values using the second channel.
Horizontal inversion: the space placed between two points on the screen. You can identify it as needed.
In my application I have set the Vmax value to 500 and the Vmin value to 0. Based on these Vmax and Vmin values, you can get the value written in the image above. If you set these values correctly, you can use the full graph when sending data between Vmax and Vmin. We need a second graph to plot the data for both channels. We can do this by copying the first graph we set up. After compiling we must change the “Data Source Channel” parameter to 1. So the two channels of the graph are different and when we send the data to the screen we will use this channel for the sending process. The format of the data sent on the screen is as follows.
0xA5 0x5A<DataLen>0x84<Channel><Data1H><Data1L>
DataLen: the number of bytes in the rest of the packet.
Channel: the graph we want to send data to
Data1H and Data1L: MSB and LSB of the 16-bit data to be sent
When setting the channel number. the requested channel is represented by 8 bits. Let’s look at Figure 1. and 3. if we want to send data to the channel. our channel values are.
0 0 0 0 1 0 1=0x05
The data we want to send to the graph has to be 16 bits, like I said before. That’s why MSB should be sent to LSB first and then the serial port should be sent to 2 bytes. If multiple data is sent to a single channel, the data can be sent to the back of the channel via the knee. However, if multiple data is sent to two channels, the data must be forwarded in a coordinated fashion. I will give you an example of a chorogram.11 2 3 Data in channels 2. let us draw 5 6 7 data on the channels. The data that we must send is as follows.
0x00 0x01 0x00 0x05 0x00 0x02 0x00 0x06 0x00 0x03 0x00 0x07
You can understand the location of the data better than the software. Now let’s look at the software. In the software section, I created two functions that can be used with Mbed OS 6. One of them sends data to a graph and the other sends data to two graphs at the same time. First, let’s take a look at the function I have prepared for the same graph.
// add point to one chart
void add_point(uint8_t pCh, uint8_t pLen, const uint16_t *p1Value){
uint8_t mCnt = 0;
lcd_buffer[mCnt++] = 0xA5; // buffer header 1
lcd_buffer[mCnt++] = 0x5A; // buffer header 2
lcd_buffer[mCnt++] = (pLen * 2) + 2; // data length
lcd_buffer[mCnt++] = 0x84; // chart data header
lcd_buffer[mCnt++] = pCh; // chart channel number
// chart value
for (int i = 0; i < pLen; i++) {
lcd_buffer[mCnt++] = (p1Value[i] & 0xFF00) >> 8; // 16 bit data MSB
lcd_buffer[mCnt++] = p1Value[i] & 0x00FF; // 16 bit data LSB
}
serial_port.write(lcd_buffer, mCnt); // send data buffer to LCD
clear_buffer(); // clear data buffer
}
We use functions to place the data we want to send to the graph into the LCD. First, we send the LCD title to the length, the graph plotting command, the desired graph channel, and the last data we want to plot. We multiply the length of the data by 2. The data that we want to draw is 16 bits, or 2 bytes. So if we were to draw 4 bytes of data, we would have to send 8 bytes. The reason we add two is that they add the channel number and the command to the packet as +2 bytes.
We don’t need to do any more work on the two drawing functions. We just need to add the second value as an argument and add the second value to the for loop to get the other data. But here’s something to note. As I said before, if we want to plot two data at the same time, we should coordinate to send the data. So if we plot two data at the same time, they should be the same length.
// add point to two charts same time
void add_point_multi(uint8_t pLen, const uint16_t *p1Value, const uint16_t *p2Value) {
uint8_t mCnt = 0;
lcd_buffer[mCnt++] = 0xA5; // buffer header 1
lcd_buffer[mCnt++] = 0x5A; // buffer header 2
lcd_buffer[mCnt++] = (pLen * 2 * 2) + 2; // data length
lcd_buffer[mCnt++] = 0x84; // chart data header
lcd_buffer[mCnt++] = 0x03; // chart channel number
for (int i = 0; i < pLen; i++) {
lcd_buffer[mCnt++] = (p1Value[i] & 0xFF00) >> 8; // 16 bit first data MSB
lcd_buffer[mCnt++] = p1Value[i] & 0x00FF; // 16 bit first data LSB
lcd_buffer[mCnt++] = (p2Value[i] & 0xFF00) >> 8; // 16 bit second data MSB
lcd_buffer[mCnt++] = p2Value[i] & 0x00FF; // 16 bit second data LSB
}
serial_port.write(lcd_buffer, mCnt); // send data buffer to LCD
clear_buffer(); // clear data buffer
}
The result is that we’ve created a function that plots two graphs at the same time, which is the same as the main circle. We’re basically reading data from the ADC and scaling the value we’re reading here. When I created a graph for 500 people to use in the scaling process, I selected that value. So we’re going to use the entire graph.
// if elapset time bigger than 10ms save adc values to arrays
if(t1.elapsed_time() > 10ms)
{
//read adc values
float nAdcVal1 = pot1.read();
float nAdcVal2 = pot2.read();
// multiply adc value to scale data
adcVal1[cnt] = nAdcVal1 * 500;
adcVal2[cnt] = nAdcVal2 * 500;
cnt++;
// reset timer
t1.reset();
}
// if adc read count equals to buffer limit draw chart
if(cnt == readCnt)
{
// add_point(1, readCnt, adcVal1); // uncomment if you want to draw one chart
add_point_multi(readCnt, adcVal1, adcVal2); // uncomment if you want to draw two charts same time
mLED = !mLED; // toggle status LED
cnt = 0; // reset counter
}
Our connection to the screen is like the last one. So I’m not going to draw it again. You can use the connection mode here for reference. You can get all the software out of there. Usually, I’m thinking about adding design buttons. But that’s going to be a long time. That’s why I decided to hide the graphic example of the button in the future.
About The Author
Muhammad Bilal
I am a highly skilled and motivated individual with a Master's degree in Computer Science. I have extensive experience in technical writing and a deep understanding of SEO practices.